

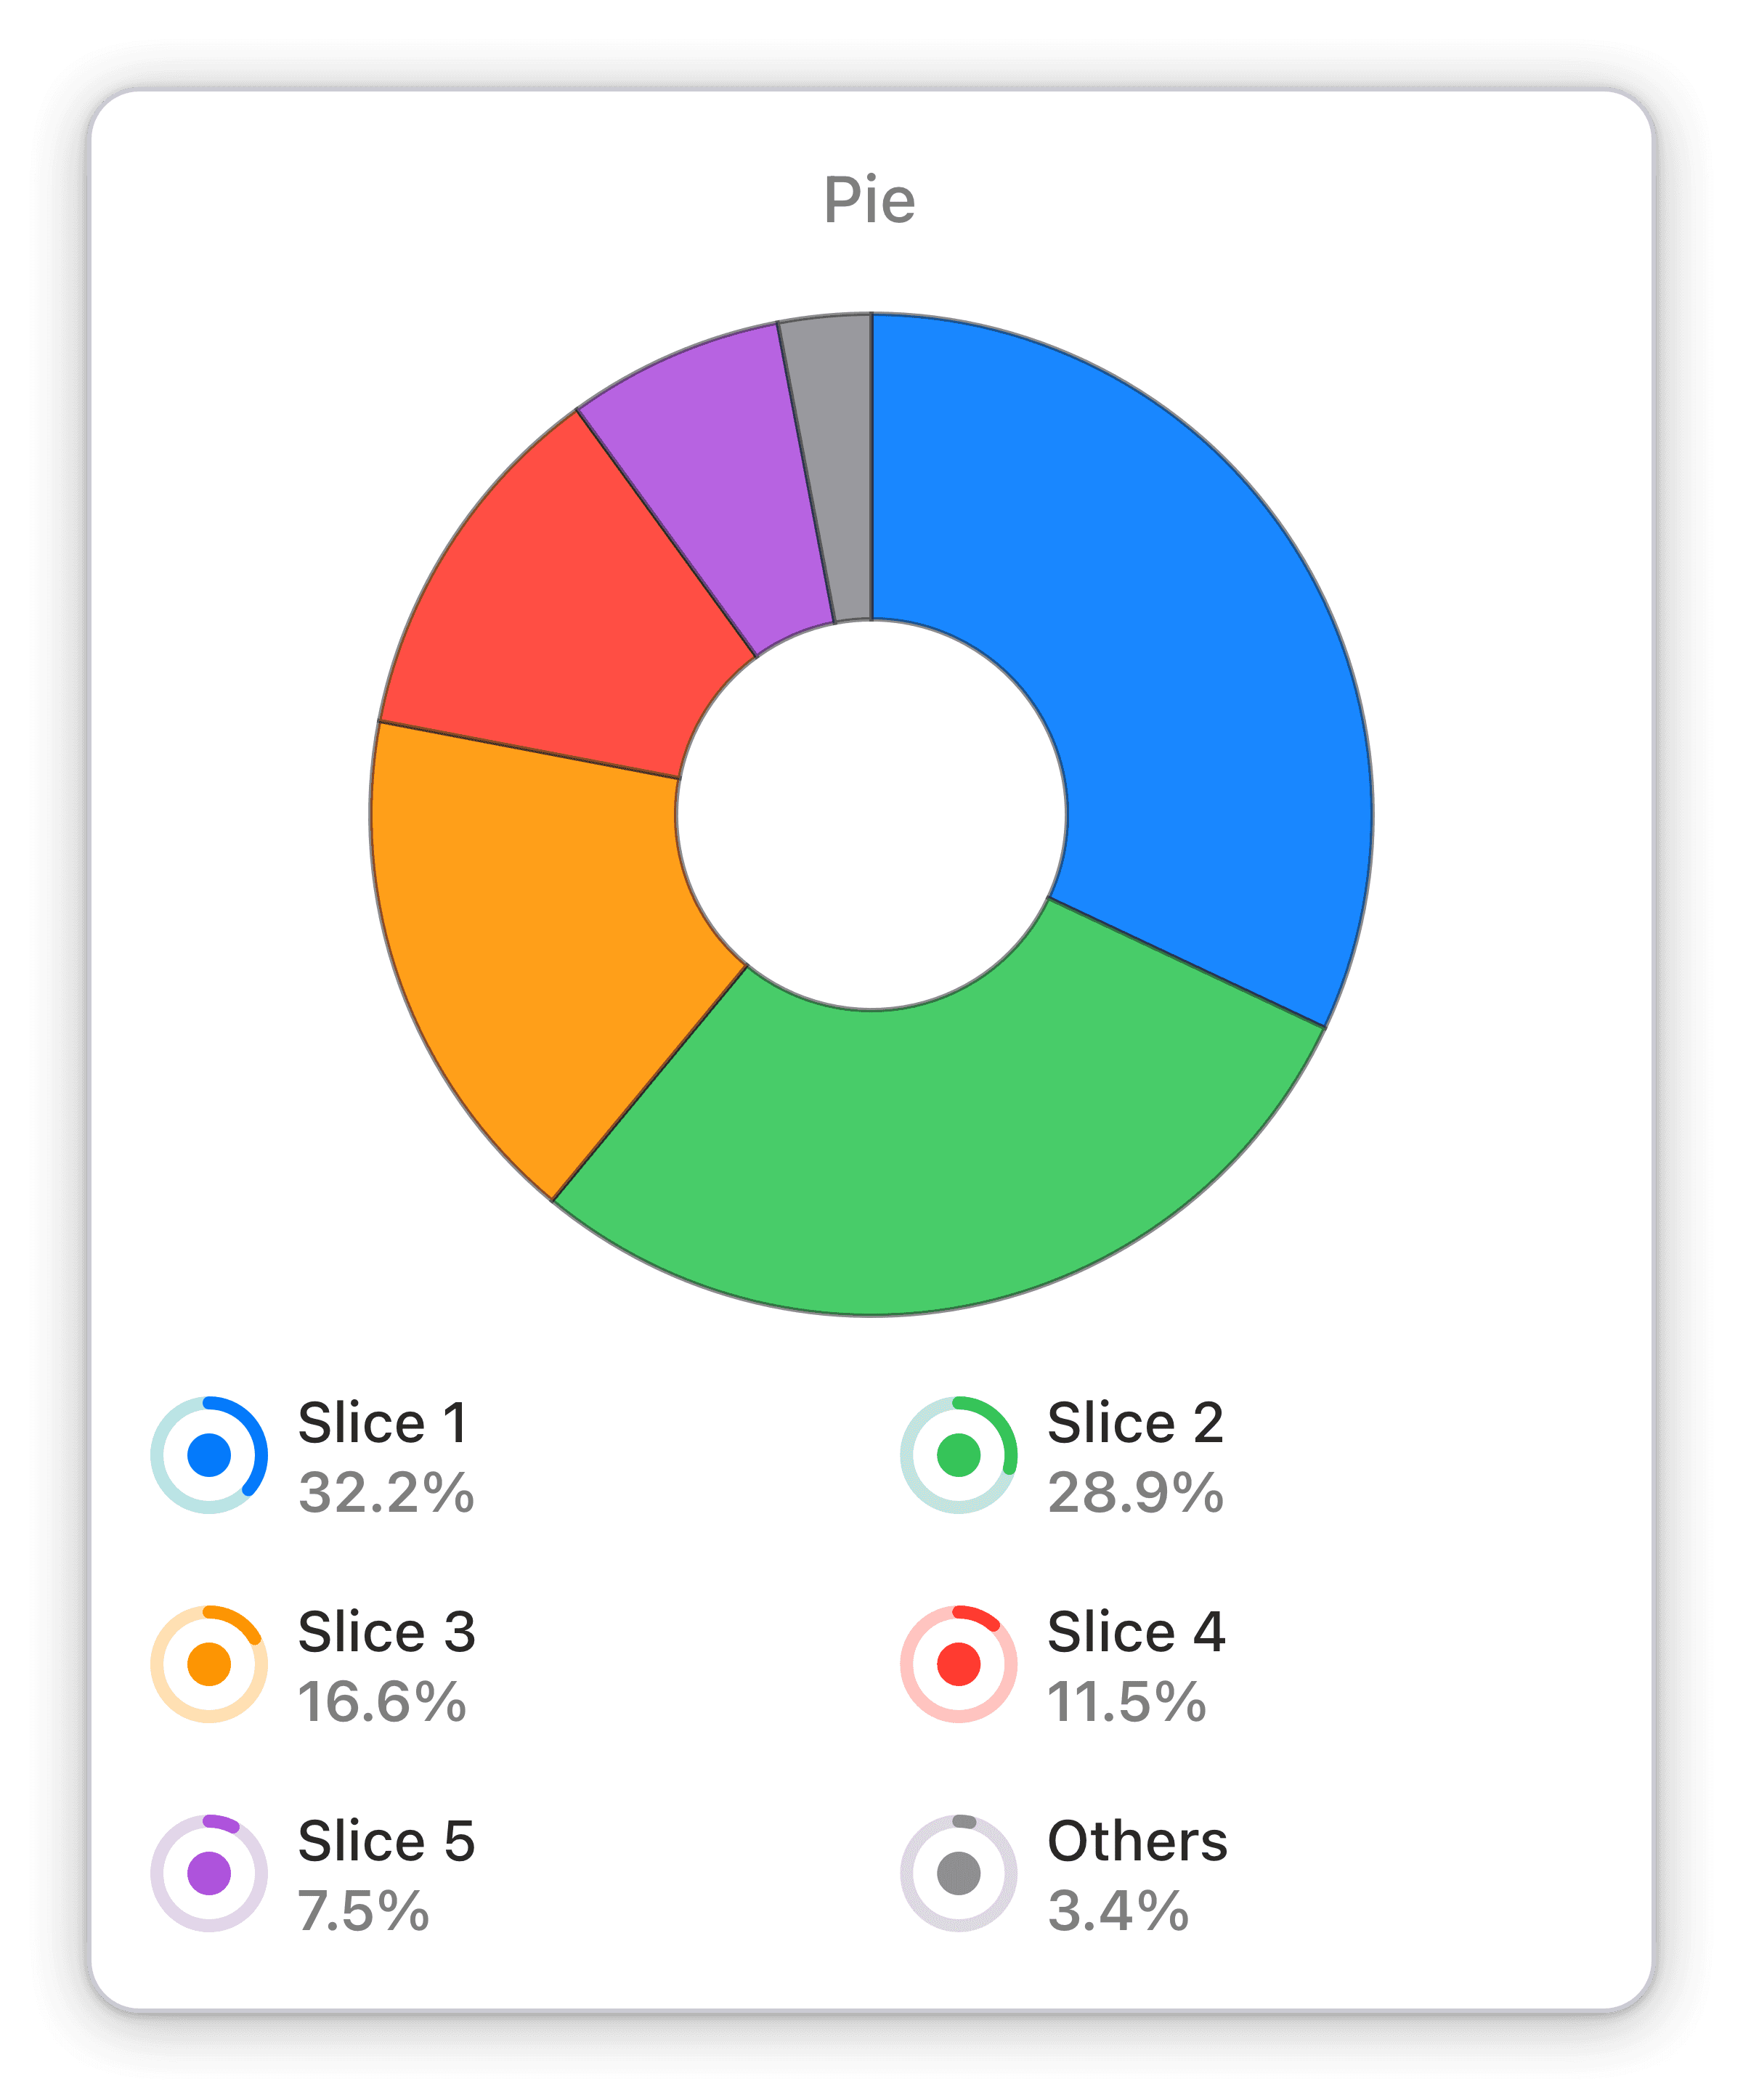
Events by device category
The events broken down by the devices users used in last 30 minutes.
Track events by device category in real-time with Numerics' Google Analytics 4 Pie Chart widget. Optimize your business strategy like never before.
With Numerics' Pie Chart widget for Google Analytics 4, track events by device category in real-time and optimize your business strategy like never before. The widget breaks down events by the devices your users are using in the last 30 minutes, giving you a real-time view of your KPIs. With its powerful Pie Chart visualization, you can be sure you're always in the know and ahead of the competition.
Benefits of Tracking Events by device category in Google Analytics 4 marketing dashboards
Are you looking for a way to stay on top of your business strategy on all your Apple devices? Look no further than Numerics. With its powerful pie chart widget for Google Analytics 4, you can track events by device category in real-time and optimize your business strategy like never before. The widget breaks down events by the devices your users are using in the last 30 minutes, giving you a real-time view of your KPIs. With Numerics, you can be sure you're always in the know and ahead of the competition.
Full Integration Details:
Part of the google analytics 4
Realtime Widget Pack
More Google Analytics 4 Widget Packs:


Google Analytics 4 Integration Specifications:
Widget Templates:
159
Authentication Type:
OAuth 2.0
Supported plans:
All
API Rate limit:
10 Requests every 1 second


