

Returning users by gender
The returning users broken down by genders within your chosen time span.
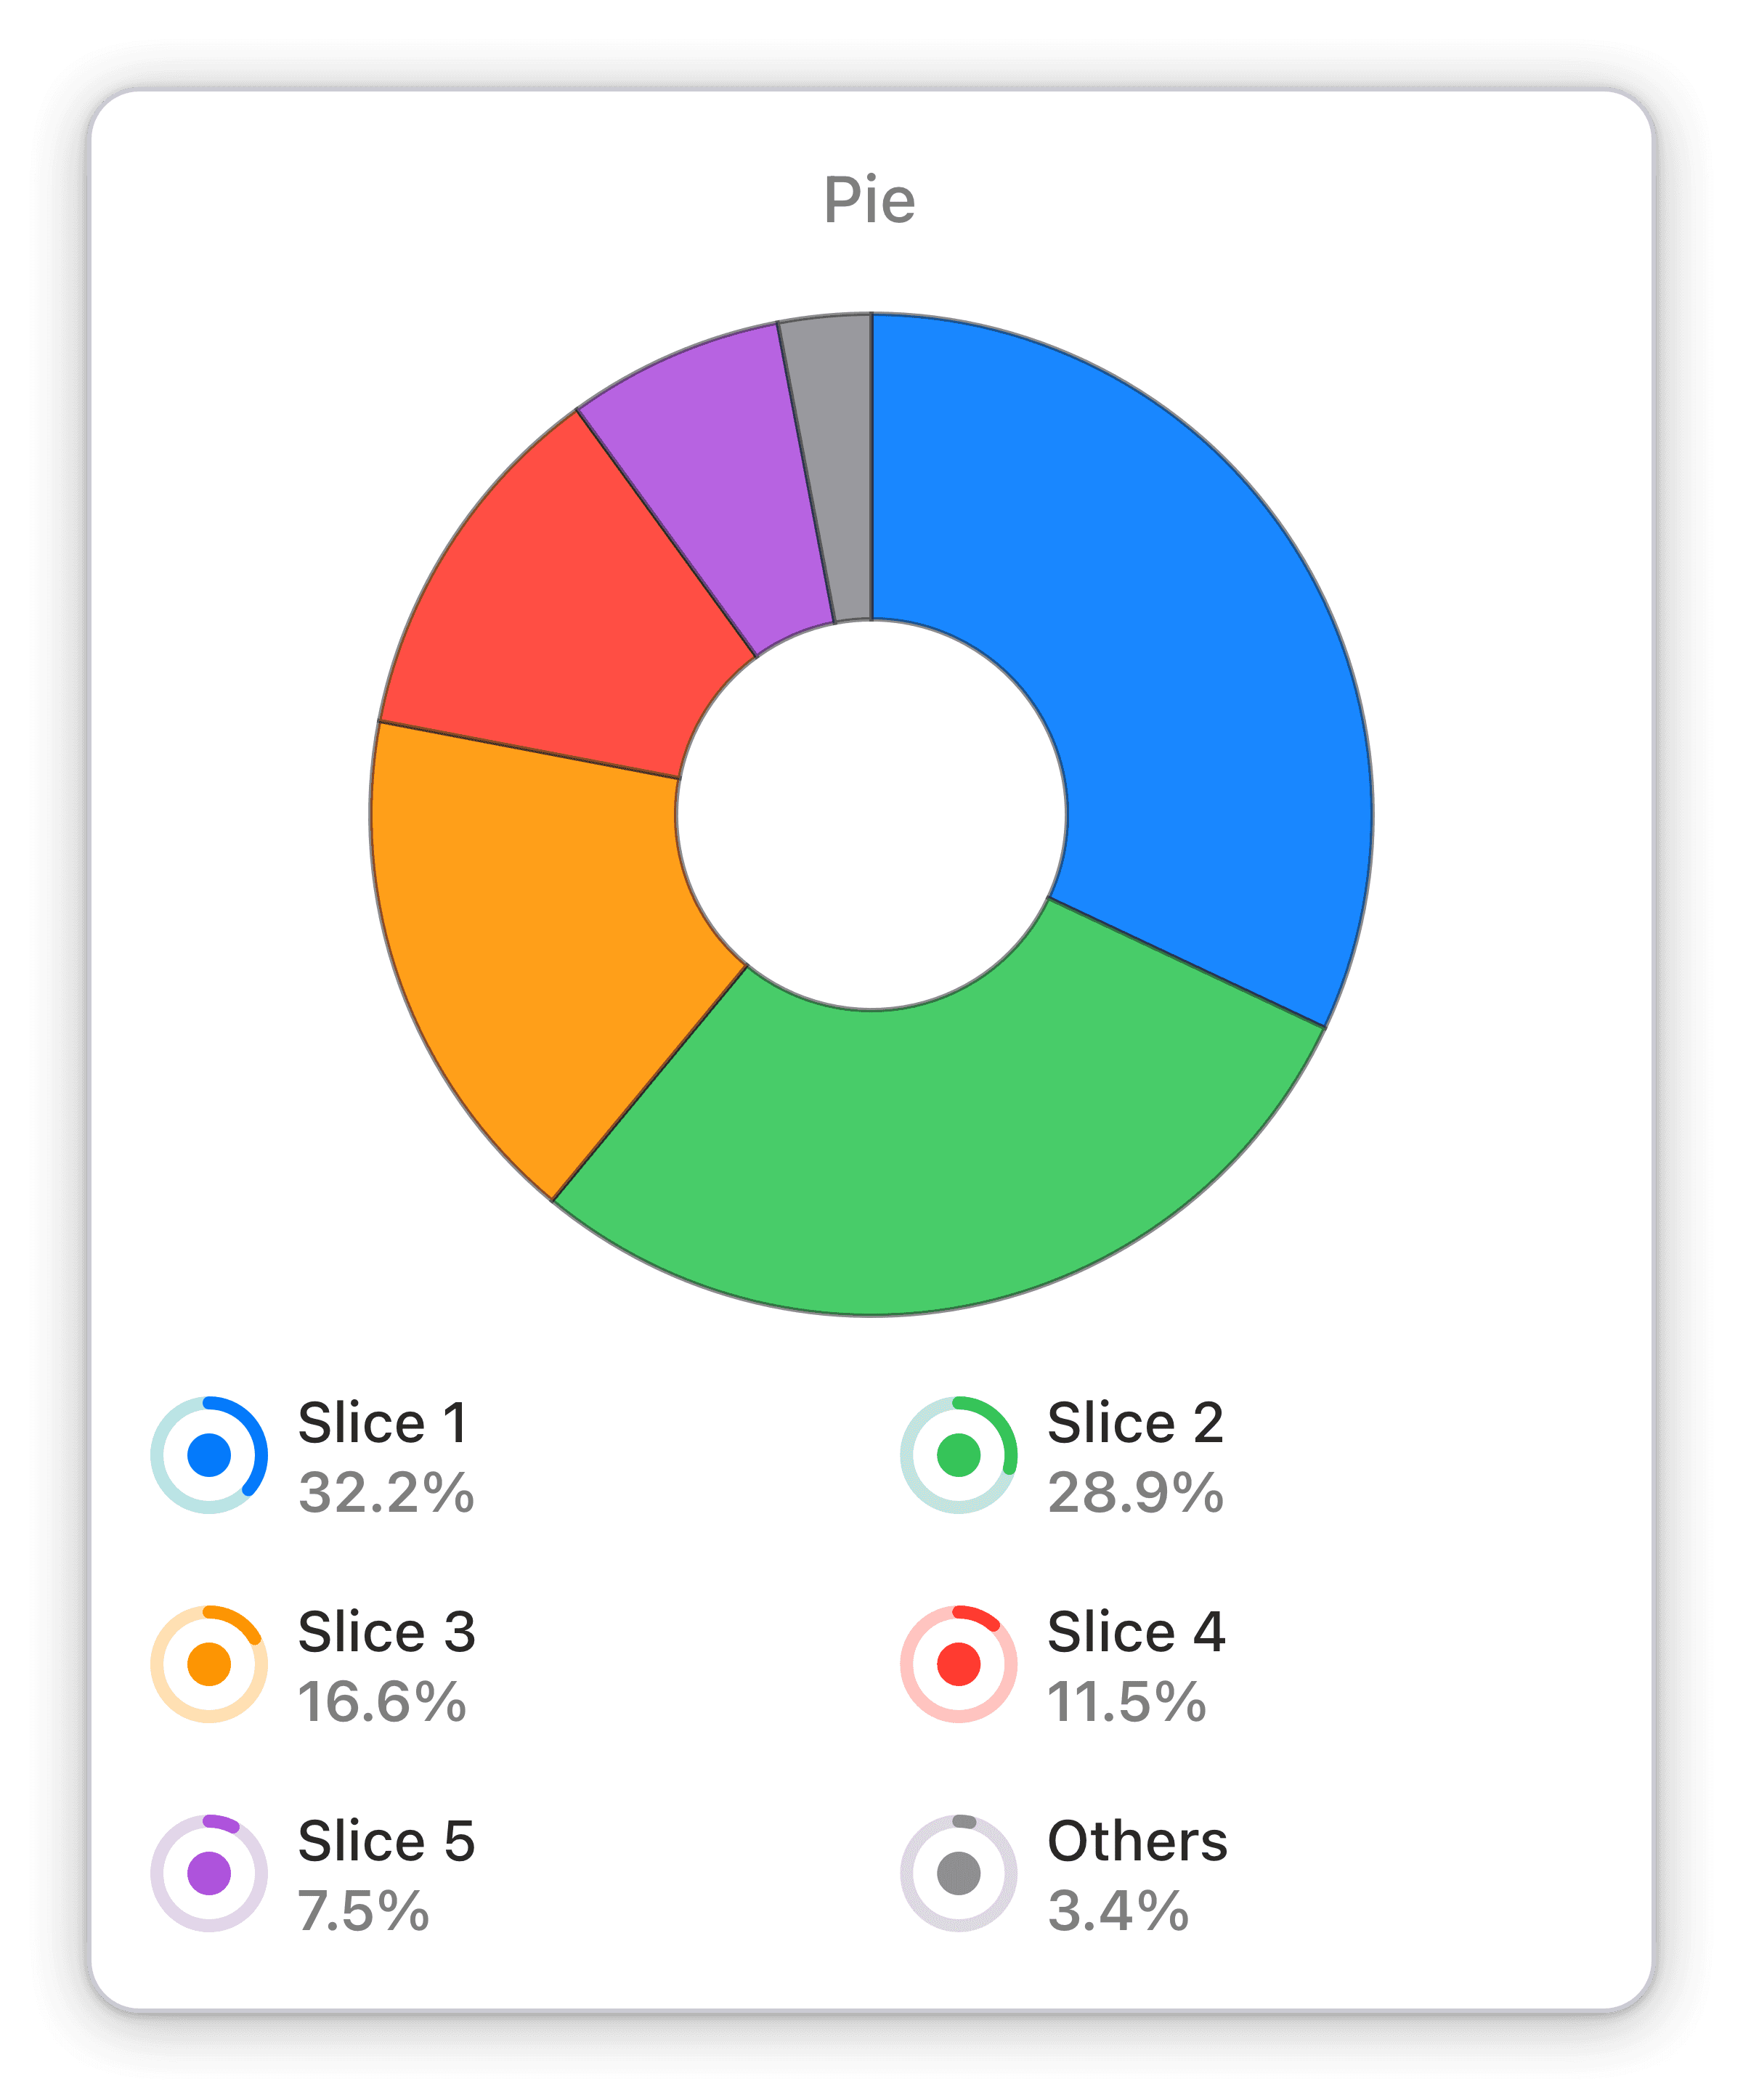
Track returning users by gender in real-time with Numerics' User Demographics Overview widget for Google Analytics 4.
Track returning users by gender in real-time with Numerics' Pie Chart widget for Google Analytics 4. The widget displays the percentage of male and female returning users within your selected timeframe. The interactive view of the Pie Chart widget provides real-time insights into user demographics, allowing you to make informed decisions to stay ahead of the competition.
Benefits of Tracking Returning users by gender in Google Analytics 4 marketing dashboards
This User Demographics Overview widget for Google Analytics 4 allows you to stay ahead of the competition by tracking returning users by gender in real-time. With Numerics, you can design live dashboards with widgets that run natively on your devices and make direct, secure connections to your data sources. The Pie Chart widget type provides an interactive view of your data, making it easy to quickly understand and analyze your KPIs. By tracking your KPIs with Numerics, you can be sure to always be aware of their real-time value, allowing you to make informed decisions and take timely action.
Full Integration Details:
Part of the google analytics 4
User Demographics Overview Widget Pack
More Google Analytics 4 Widget Packs:


Google Analytics 4 Integration Specifications:
Widget Templates:
159
Authentication Type:
OAuth 2.0
Supported plans:
All
API Rate limit:
10 Requests every 1 second


