Developer API to connect to custom CSV data
Create dashboards with data from Custom CSV data.
The CSV widgets are designed to render information from custom enterprise business software that are typically setup behind a firewall and accessed over VPN. To display widgets in Numerics either the business software itself or some form of ‘middleware’ needs to make the required data available in the CSV format according to the Numerics Widget Data Specification at a URL accessible by Numerics.
Each widget type with its data specification are listed below. Your CSV output should be precisely formatted as in the examples below. Once the CSV data is available, simply enter the entire URL to the CSV data into the path field of the widget. e.g. http://yourcompany.com/path/to/data.csv
Please Note: You must specify the full URL to your CSV data, including the ‘http://’ or ‘https://’ parts of the URL for the source.
CSV Custom Label
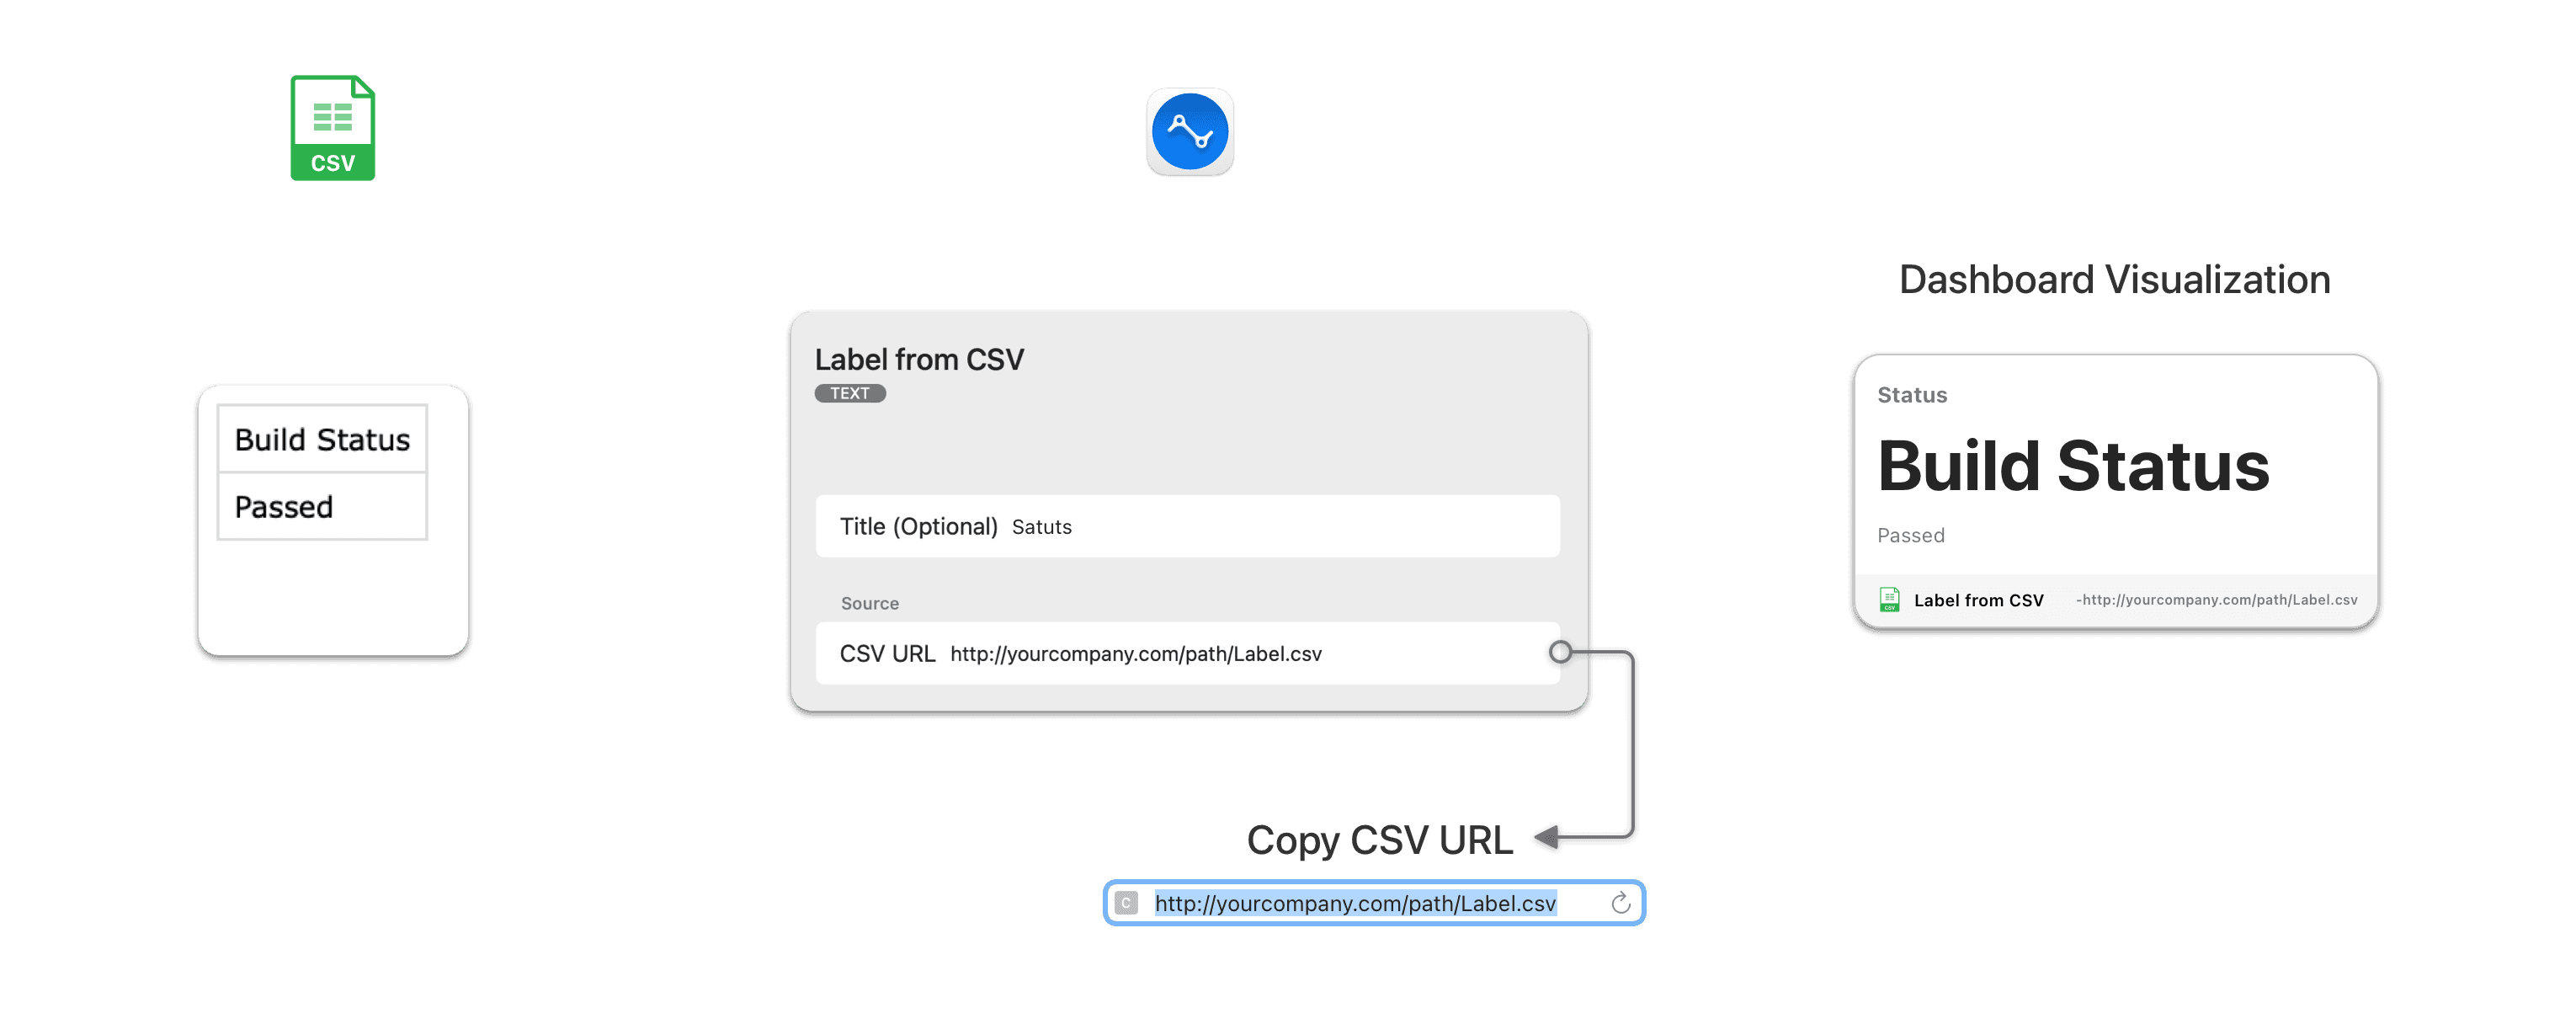
Following is the Widget Data Spec for a label widget:
Sales Conference
5th November
The column header name of the first row is displayed as the postfix (units) and the second row is displayed as the main text value. Your CSV output should be precisely formatted as above.
CSV Custom Count
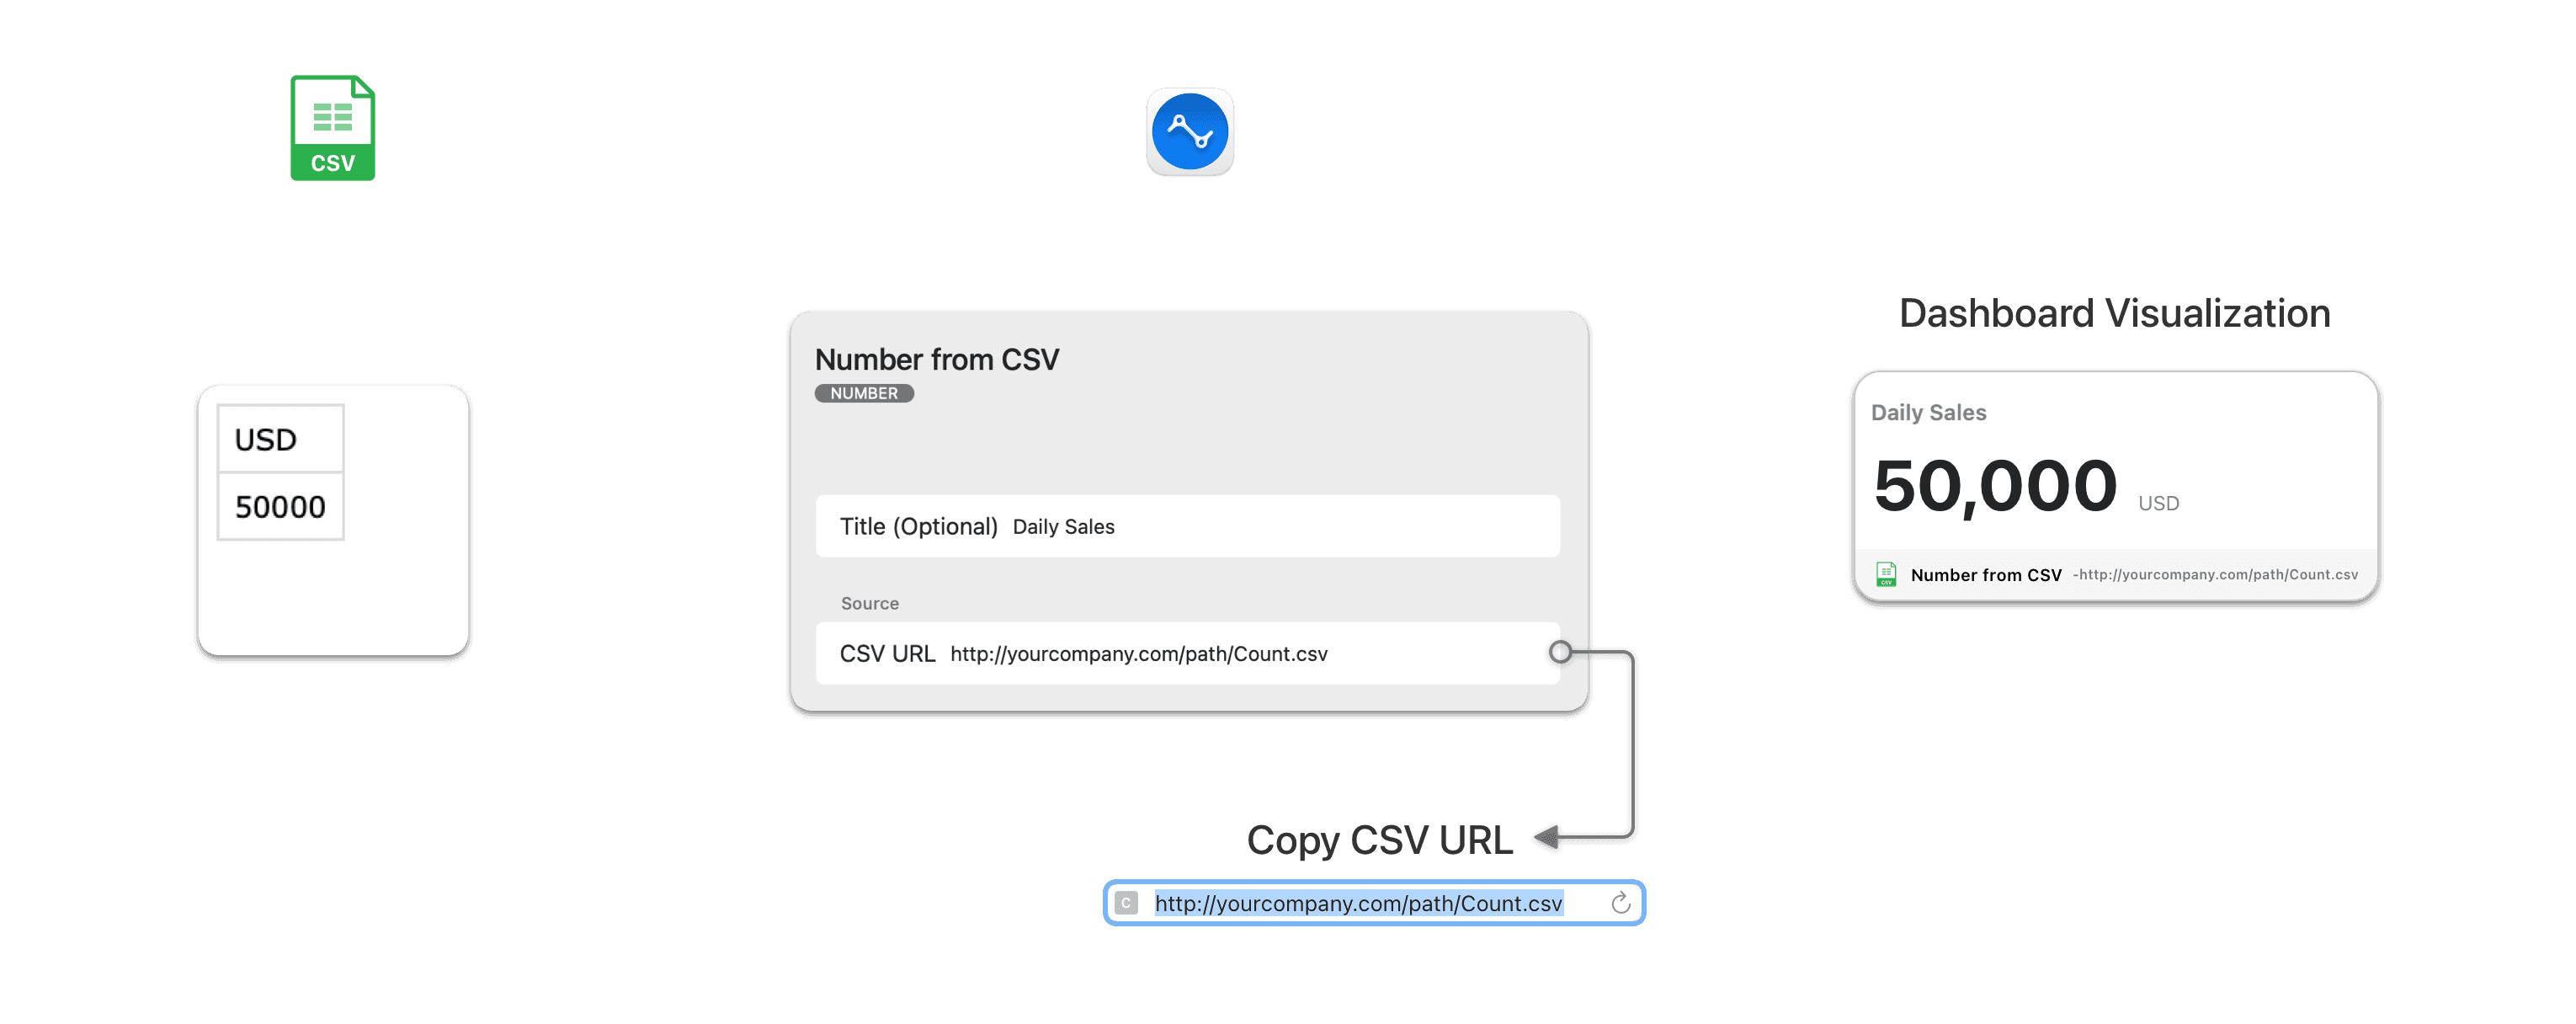
Following is the Widget Data Spec for a number widget:
Sales
420
The column header name of the first row is displayed as the postfix (units) and the second row is displayed as the main numeric value.
CSV Custom Count with Change
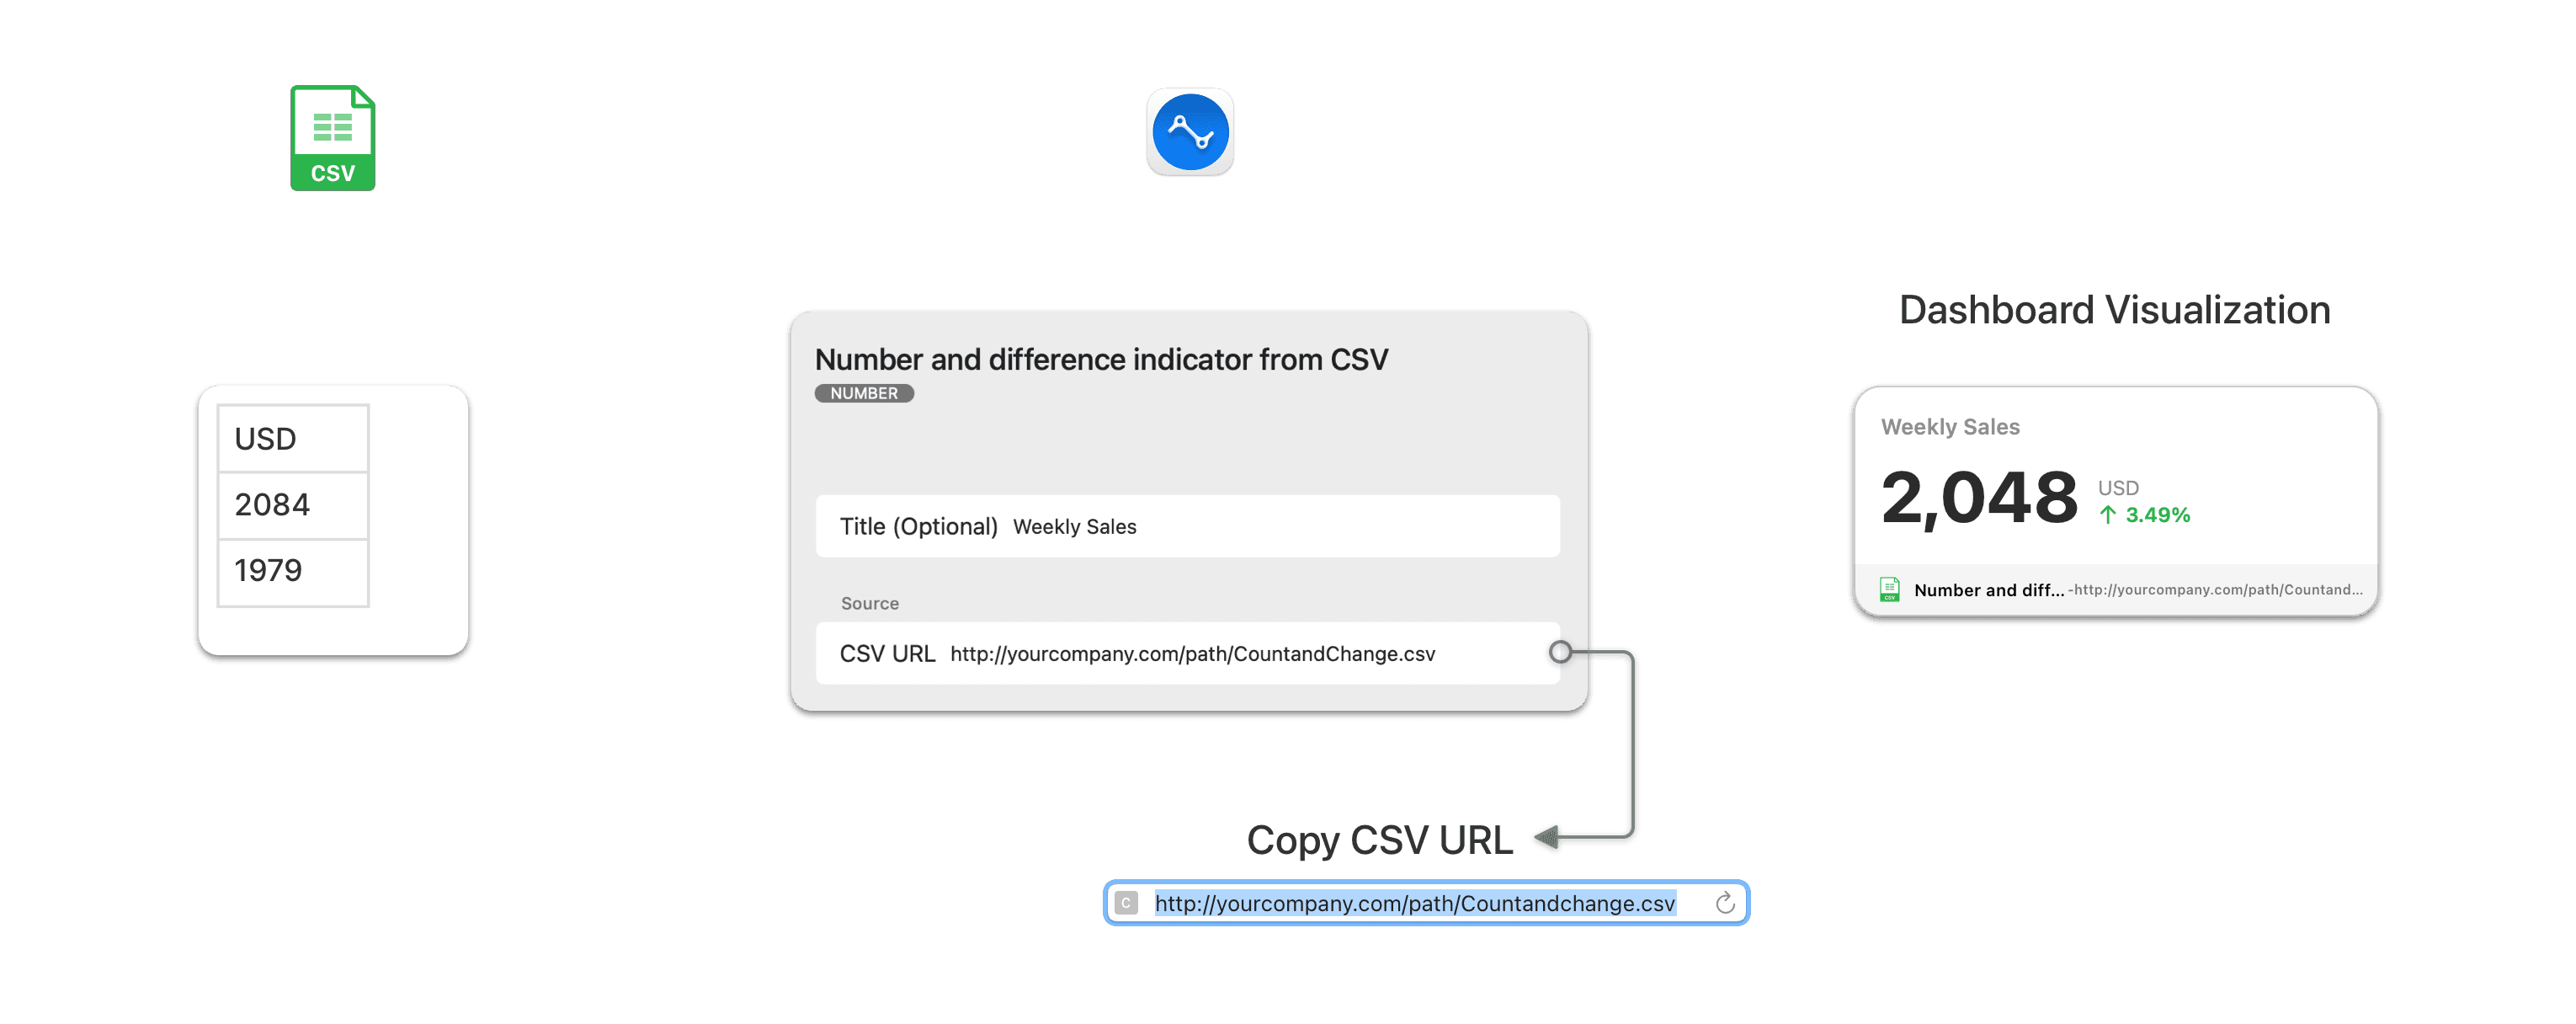
Following is the Widget Data Spec for a number with change indicator widget:
Sales
1386
1500
The column header name of the first row is displayed as the postfix (units). The second row is displayed as the main numeric value and the value in the third row is use to calculate the difference compared to the current value.
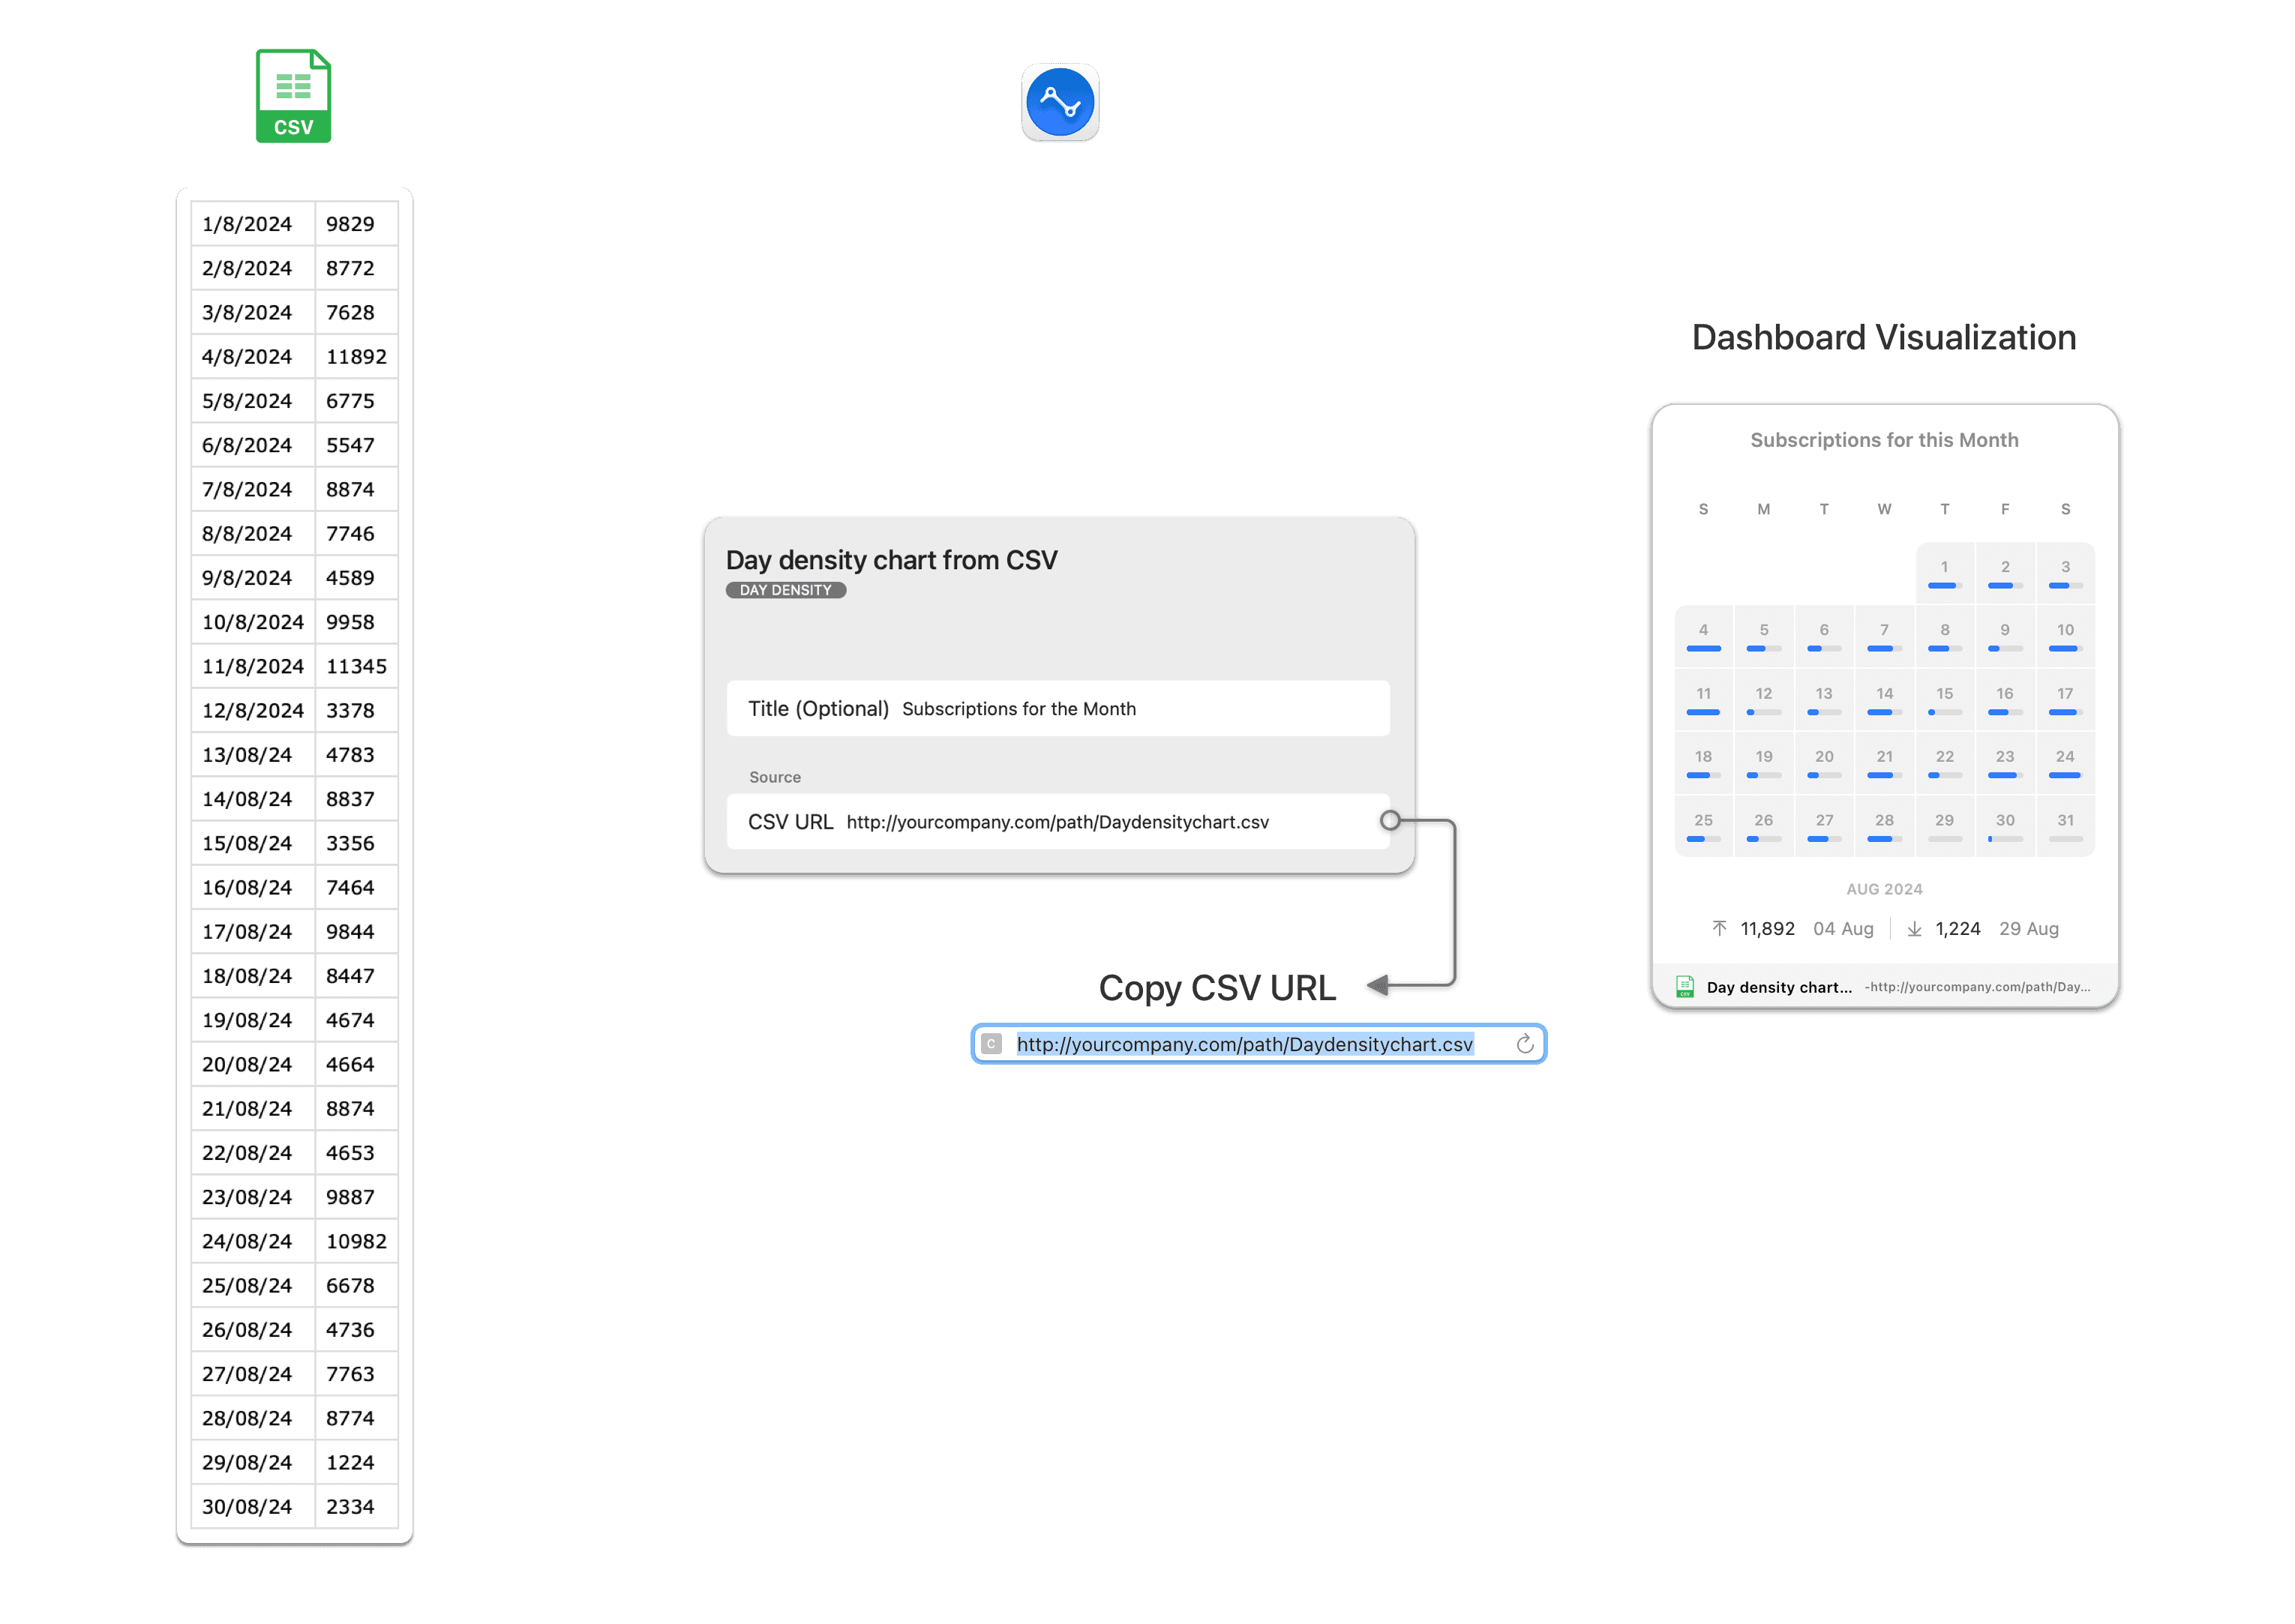
CSV Custom Month Density
Following is the Widget Data Spec for a day density calendar widget:
date,value
2018-07-01,400
2018-07-02,100
2018-07-03,500
2018-07-29,34
2018-07-30,1678
2014-07-31,300
The first column header name must be date and the second column header name must be value. The first column must list the days of a single month, and must be indicate format. The second column must have the corresponding number values that indicate the value of each day. The values are settable by your system but the column header names must be named as above.
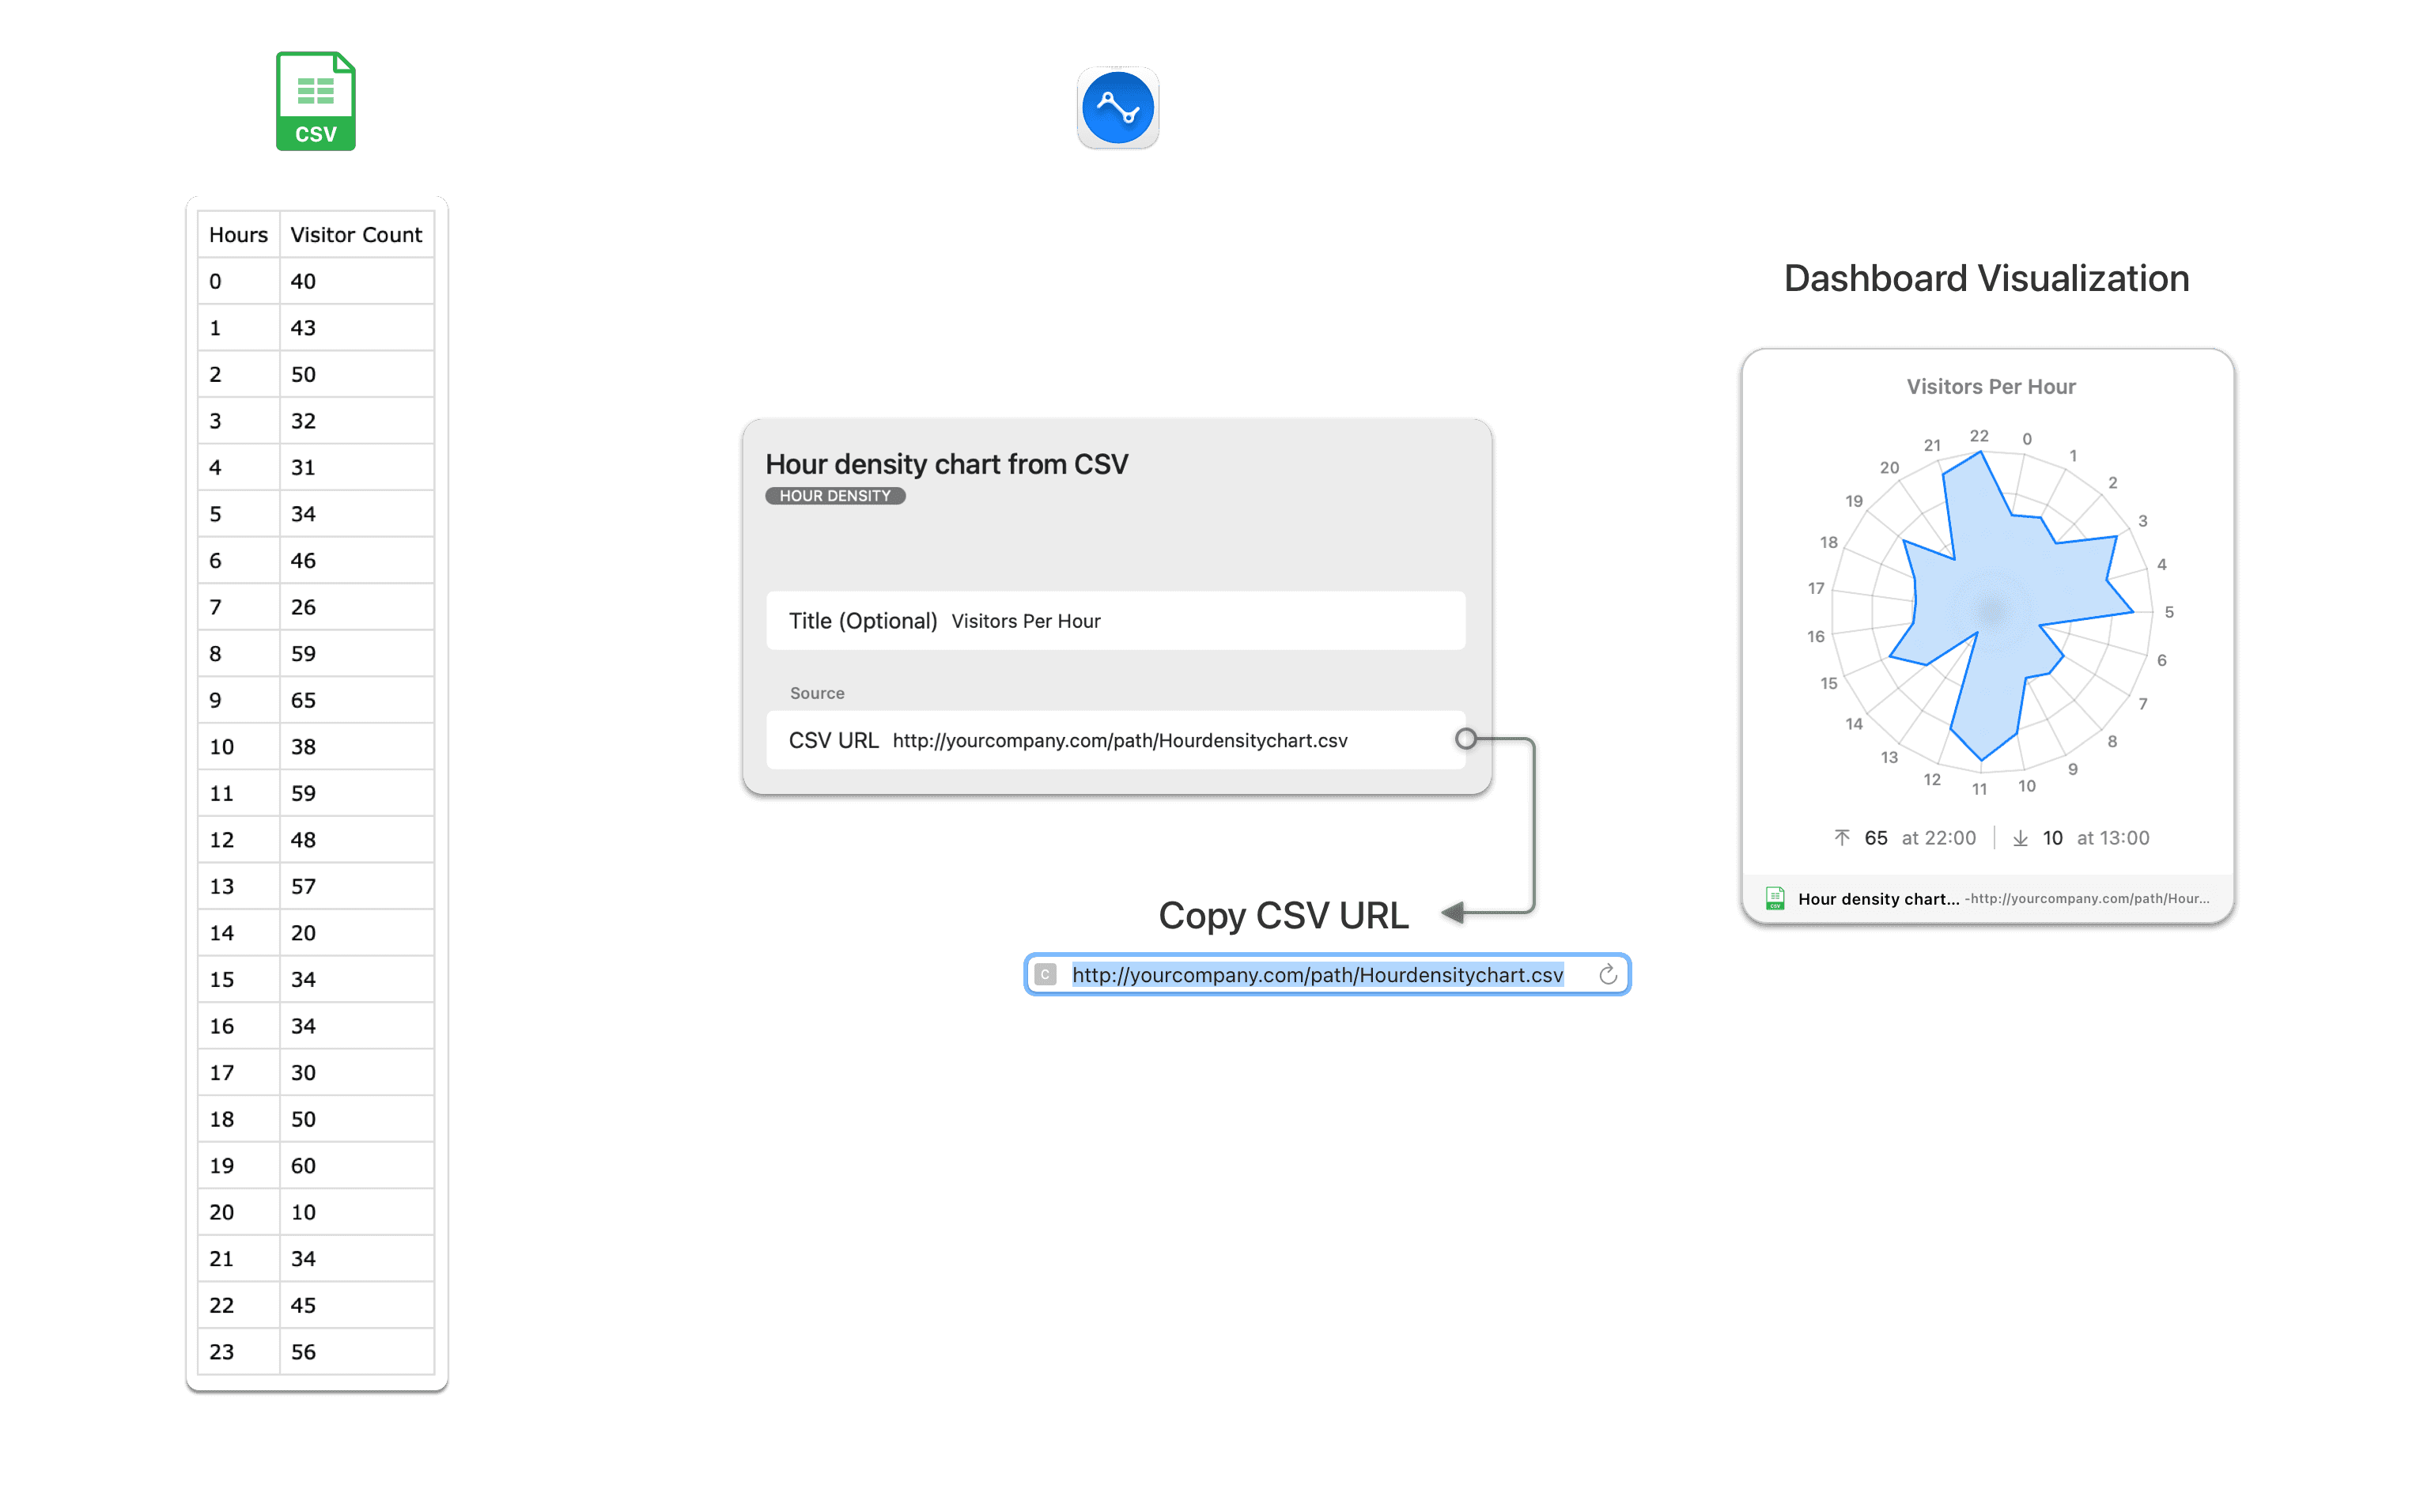
CSV Custom Day Density
Following is the Widget Data Spec for an hour density clock widget:
hour,value
0,400
1,100
2,500
3,800
21,340
22,340
23,1978
The CSV must contain items for 24 hours for a single day. The first column header name must be hour and the second column header name must be value. The first column must list the 24 hours of the day and must be a number between 0 and 24, while the second column must have the number values that indicate the value of each hour. The values are settable by your system but the column headers must be named as above with no spaces or special characters.
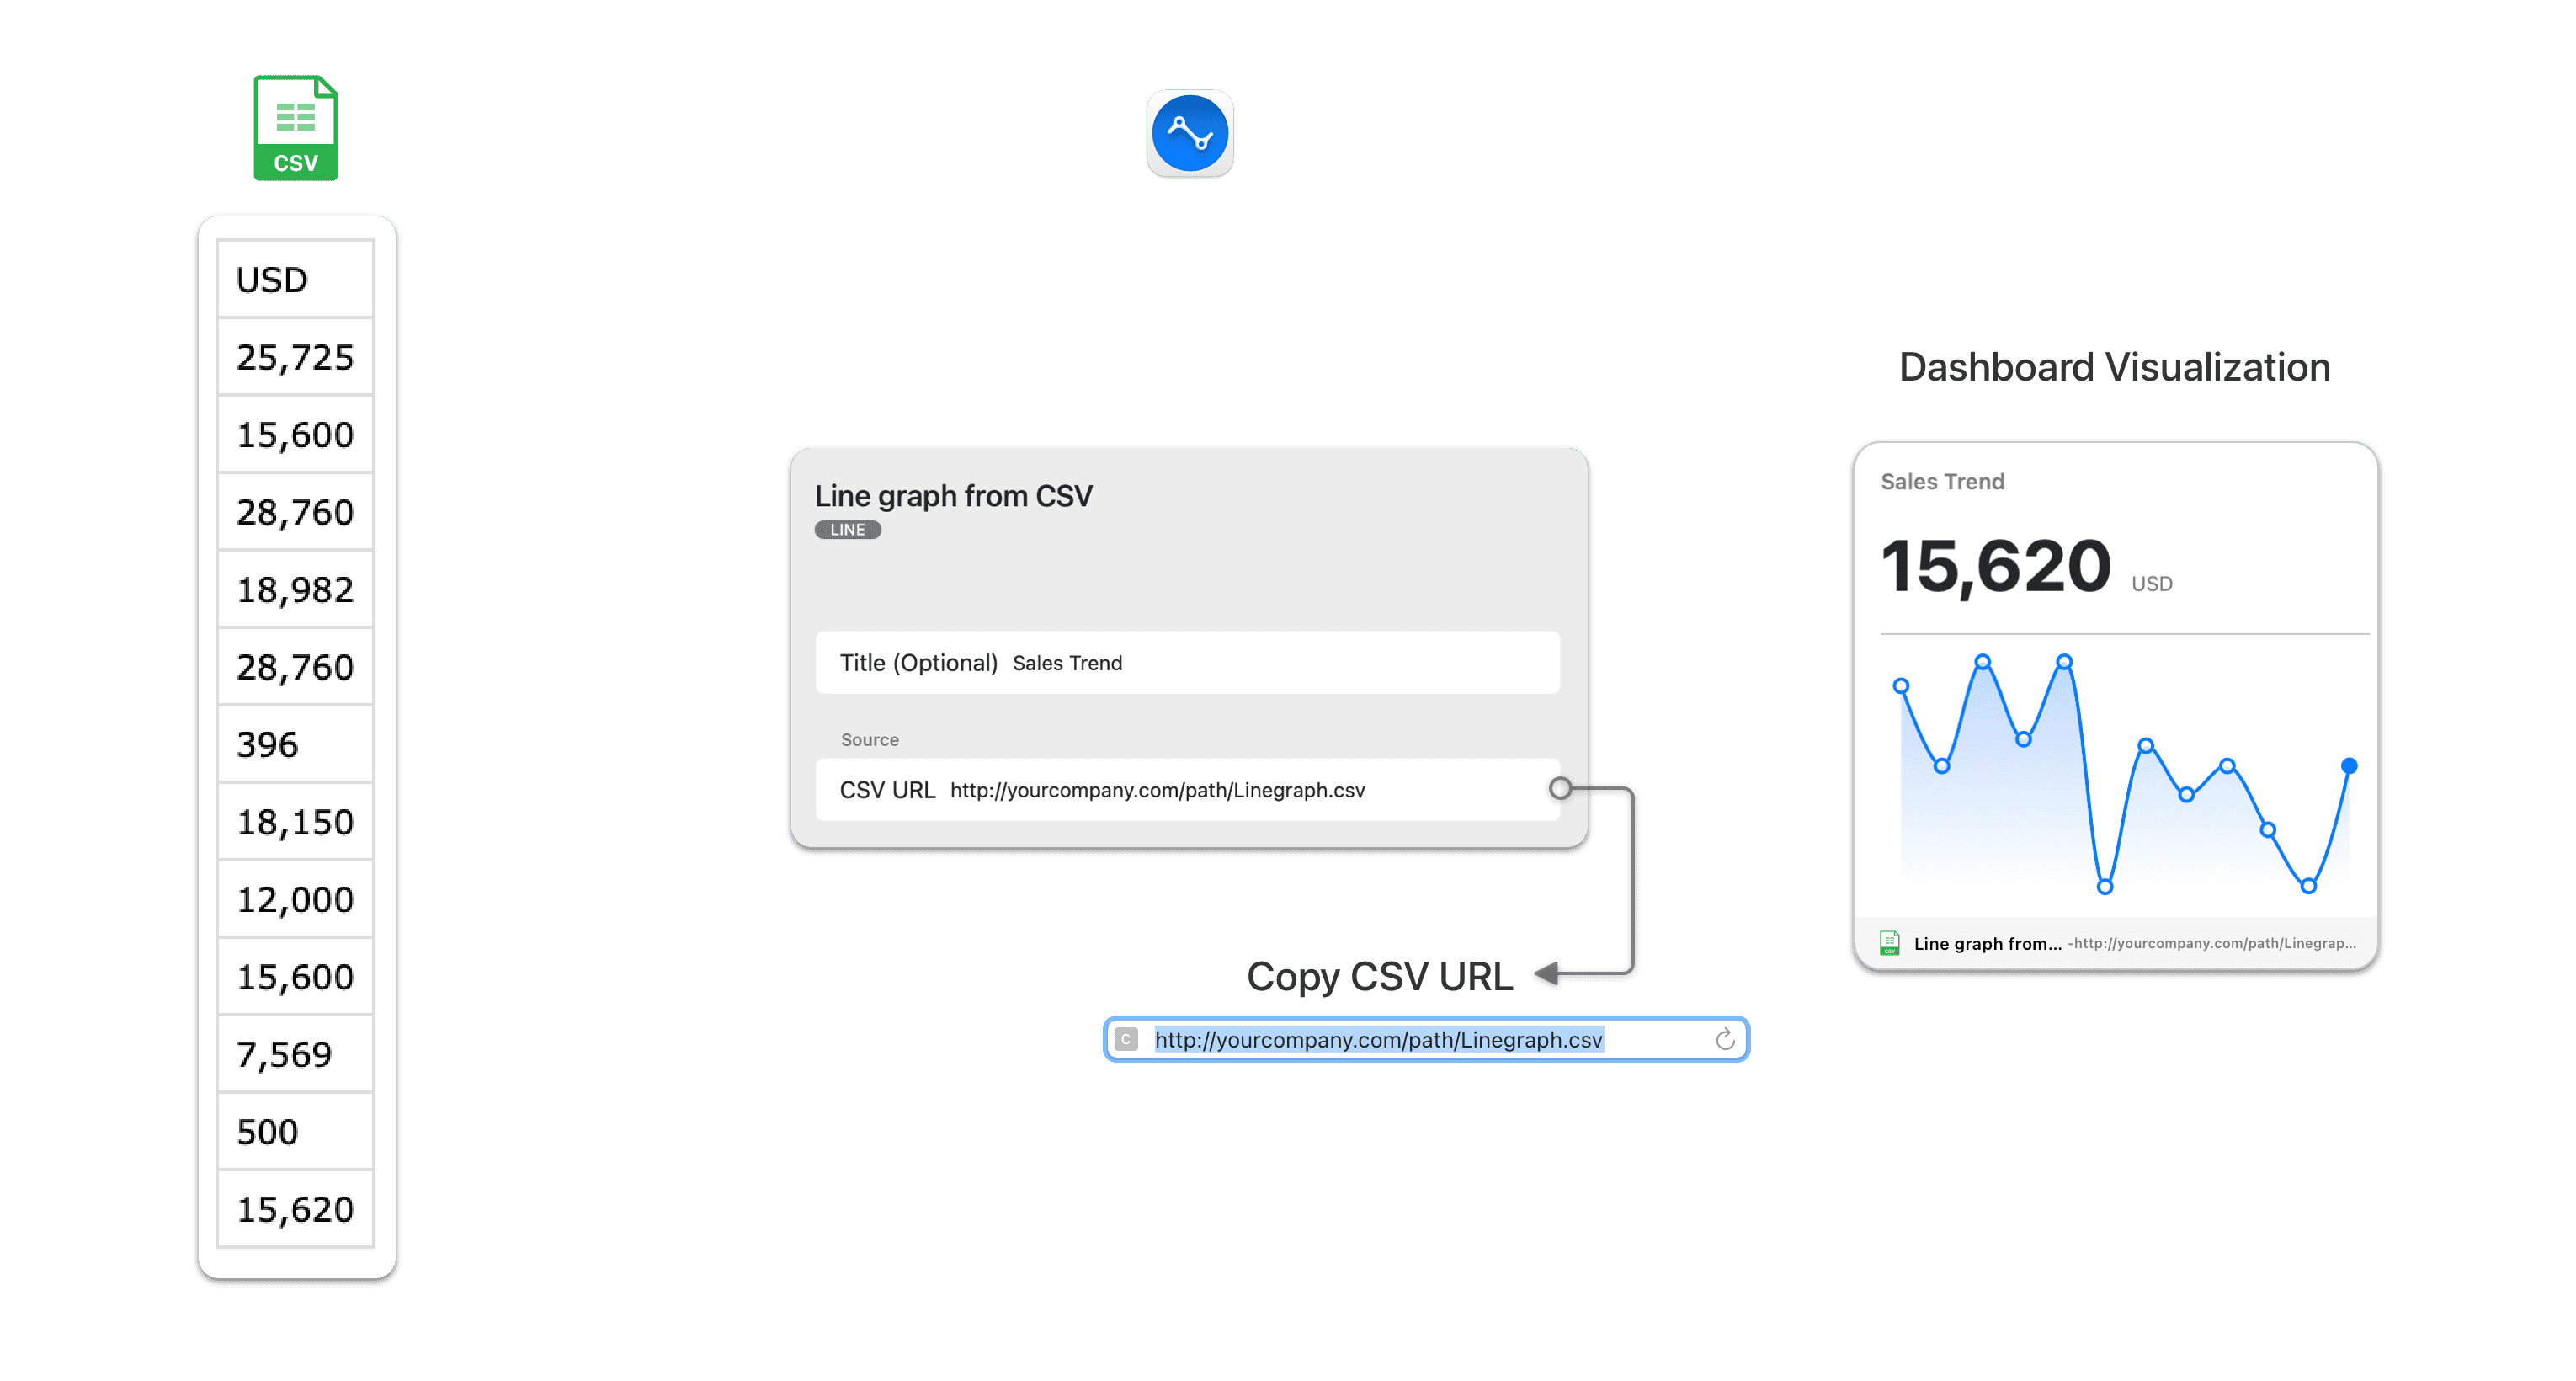
CSV Custom Line Graph
Following is the Widget Data Spec for a line graph widget:
Sales
400
100
500
340
678
The CSV can contain a maximum of 31 items. The column header name of the first row is displayed as the postfix (units) for all the values presented on the line graph and can be any value including date or text. The number values that are used as y-axis values to plot your custom line graph must be listed as values in new lines under the first column. The values are settable by your system but the keys must be named as above.
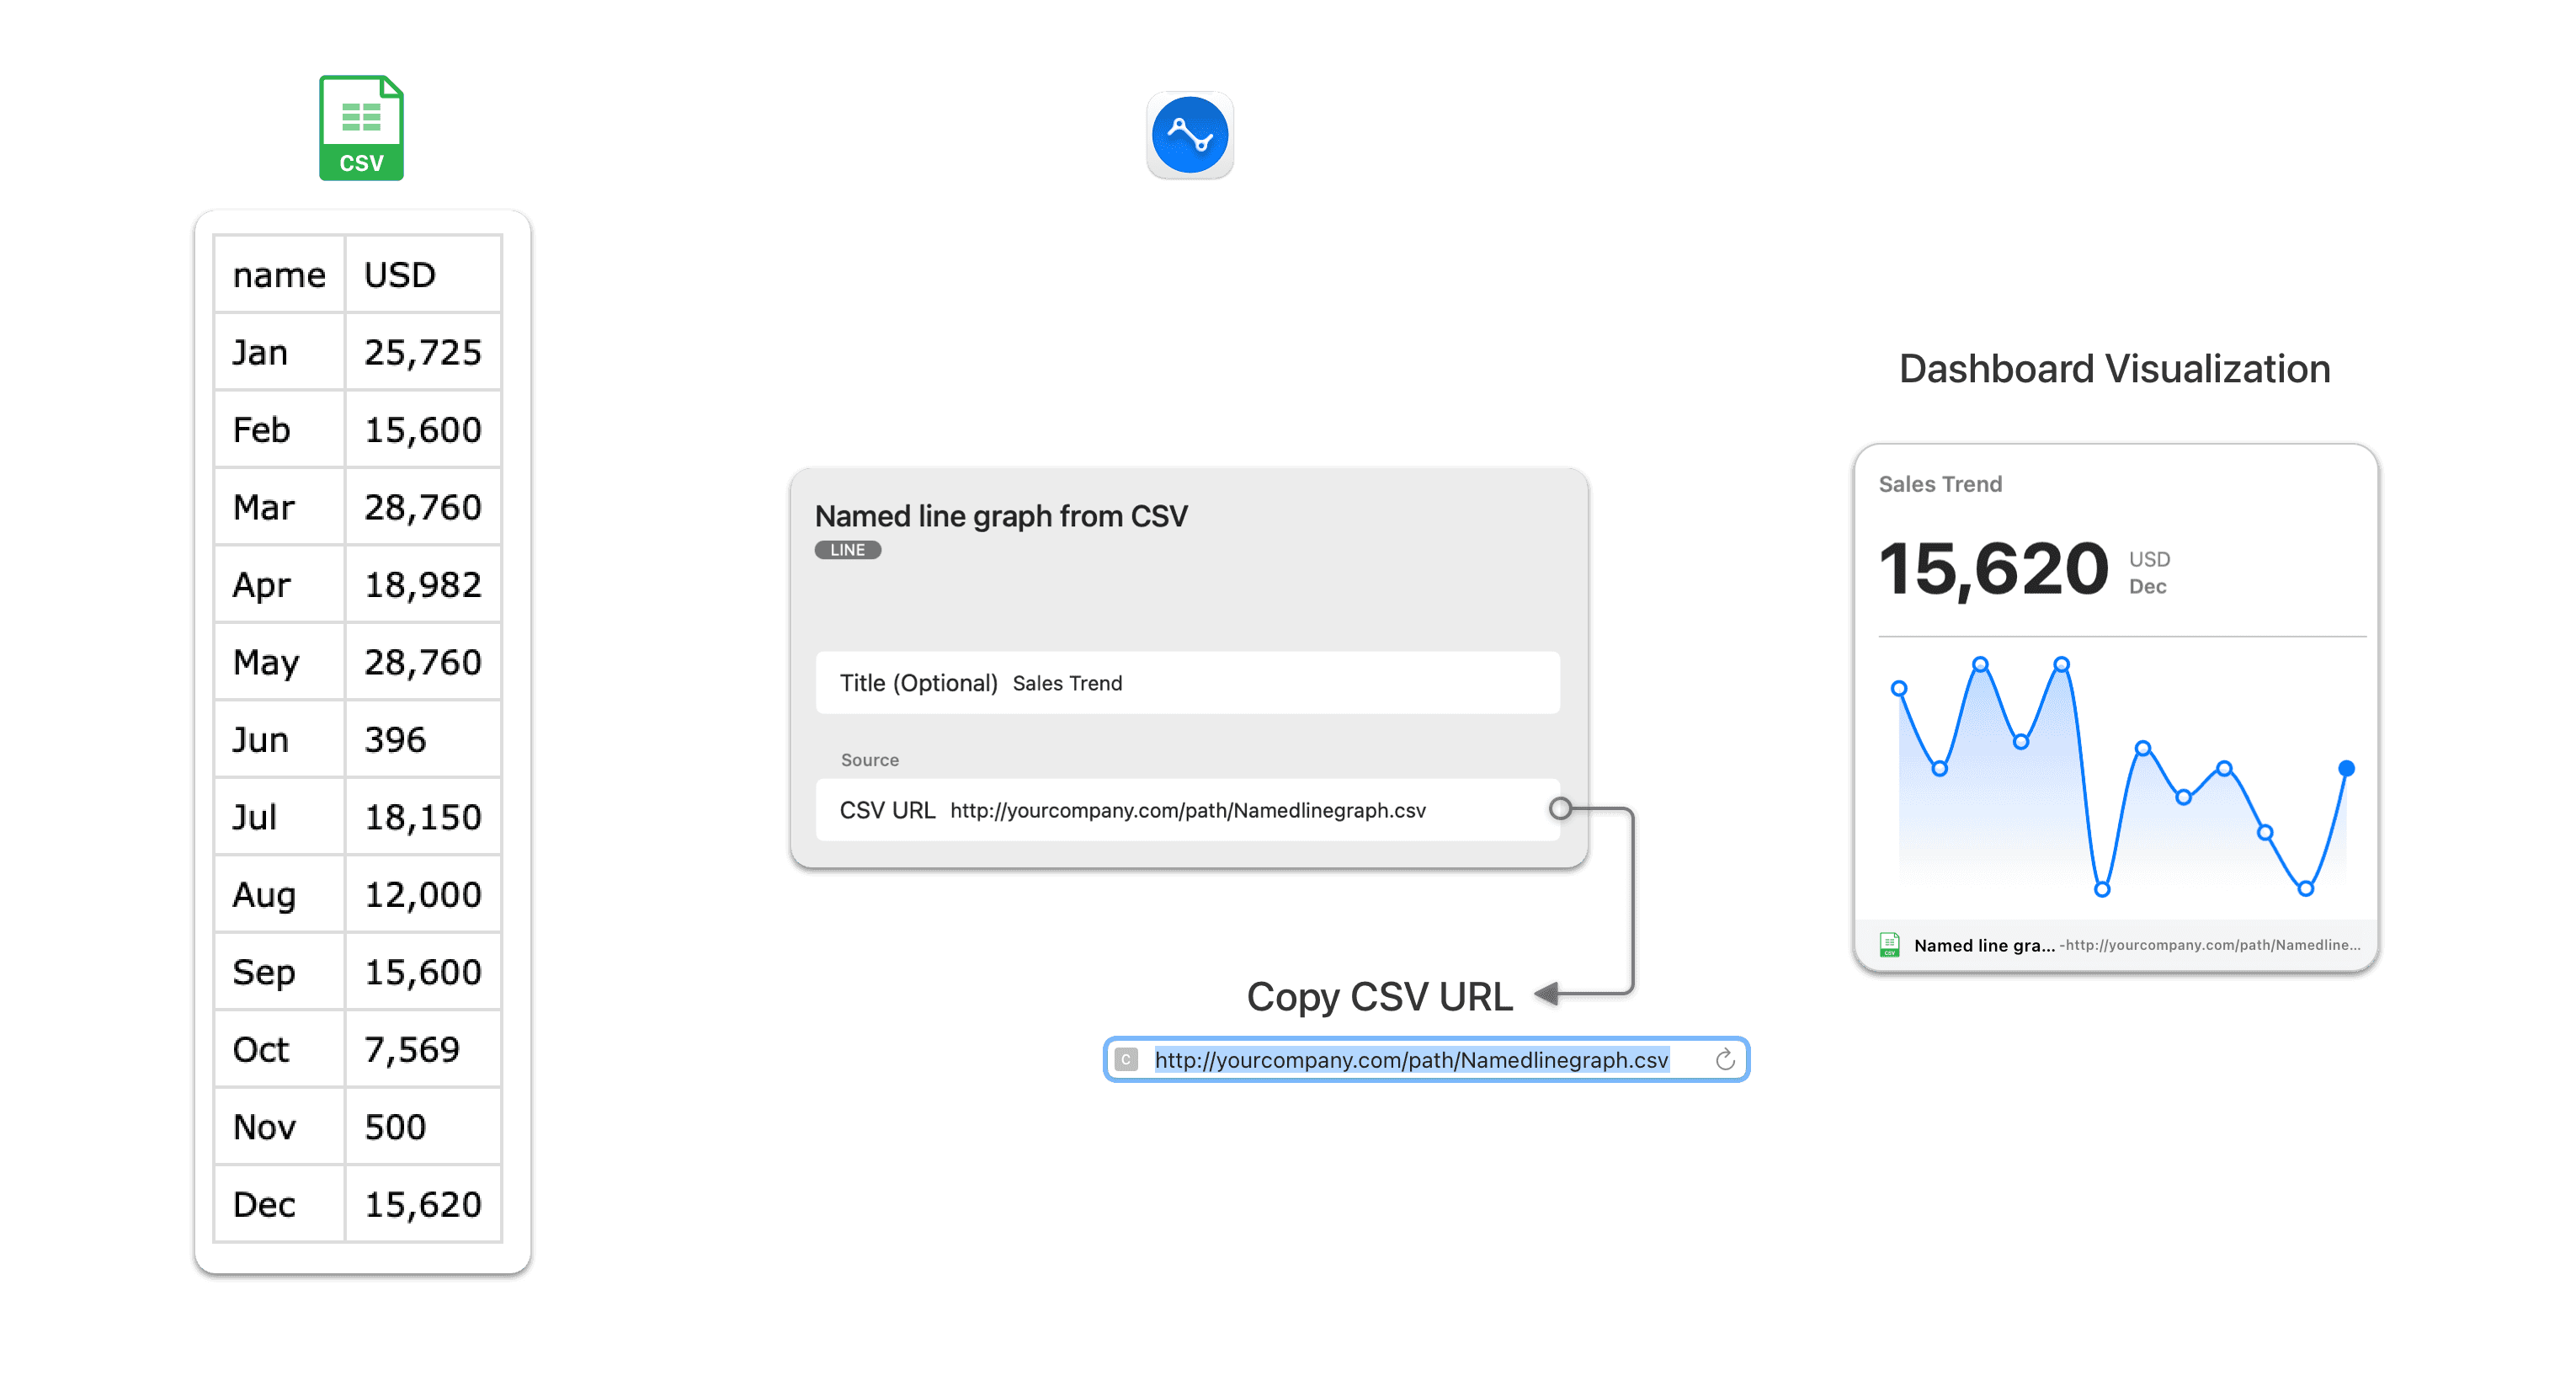
CSV Custom Named Line Graph
Following is the Widget Data Spec for a named line graph widget:
Date,Sales
2014-07-01,400
2014-07-02,100
2014-07-03,500
2014-07-30,1678
2014-07-31,300
The CSV can contain a maximum of 31 items. The column header name of the first row and the values below will form the names of the items plotted on the x-axis. This can be any value including date or text without any spaces or special characters. The second column header name forms the postfix (units) for the values under it. The values in the second column are used as y-axis values against each item of the x-axis to plot your custom line graph. The values and column header names are settable by your system but must have no spaces or special characters.
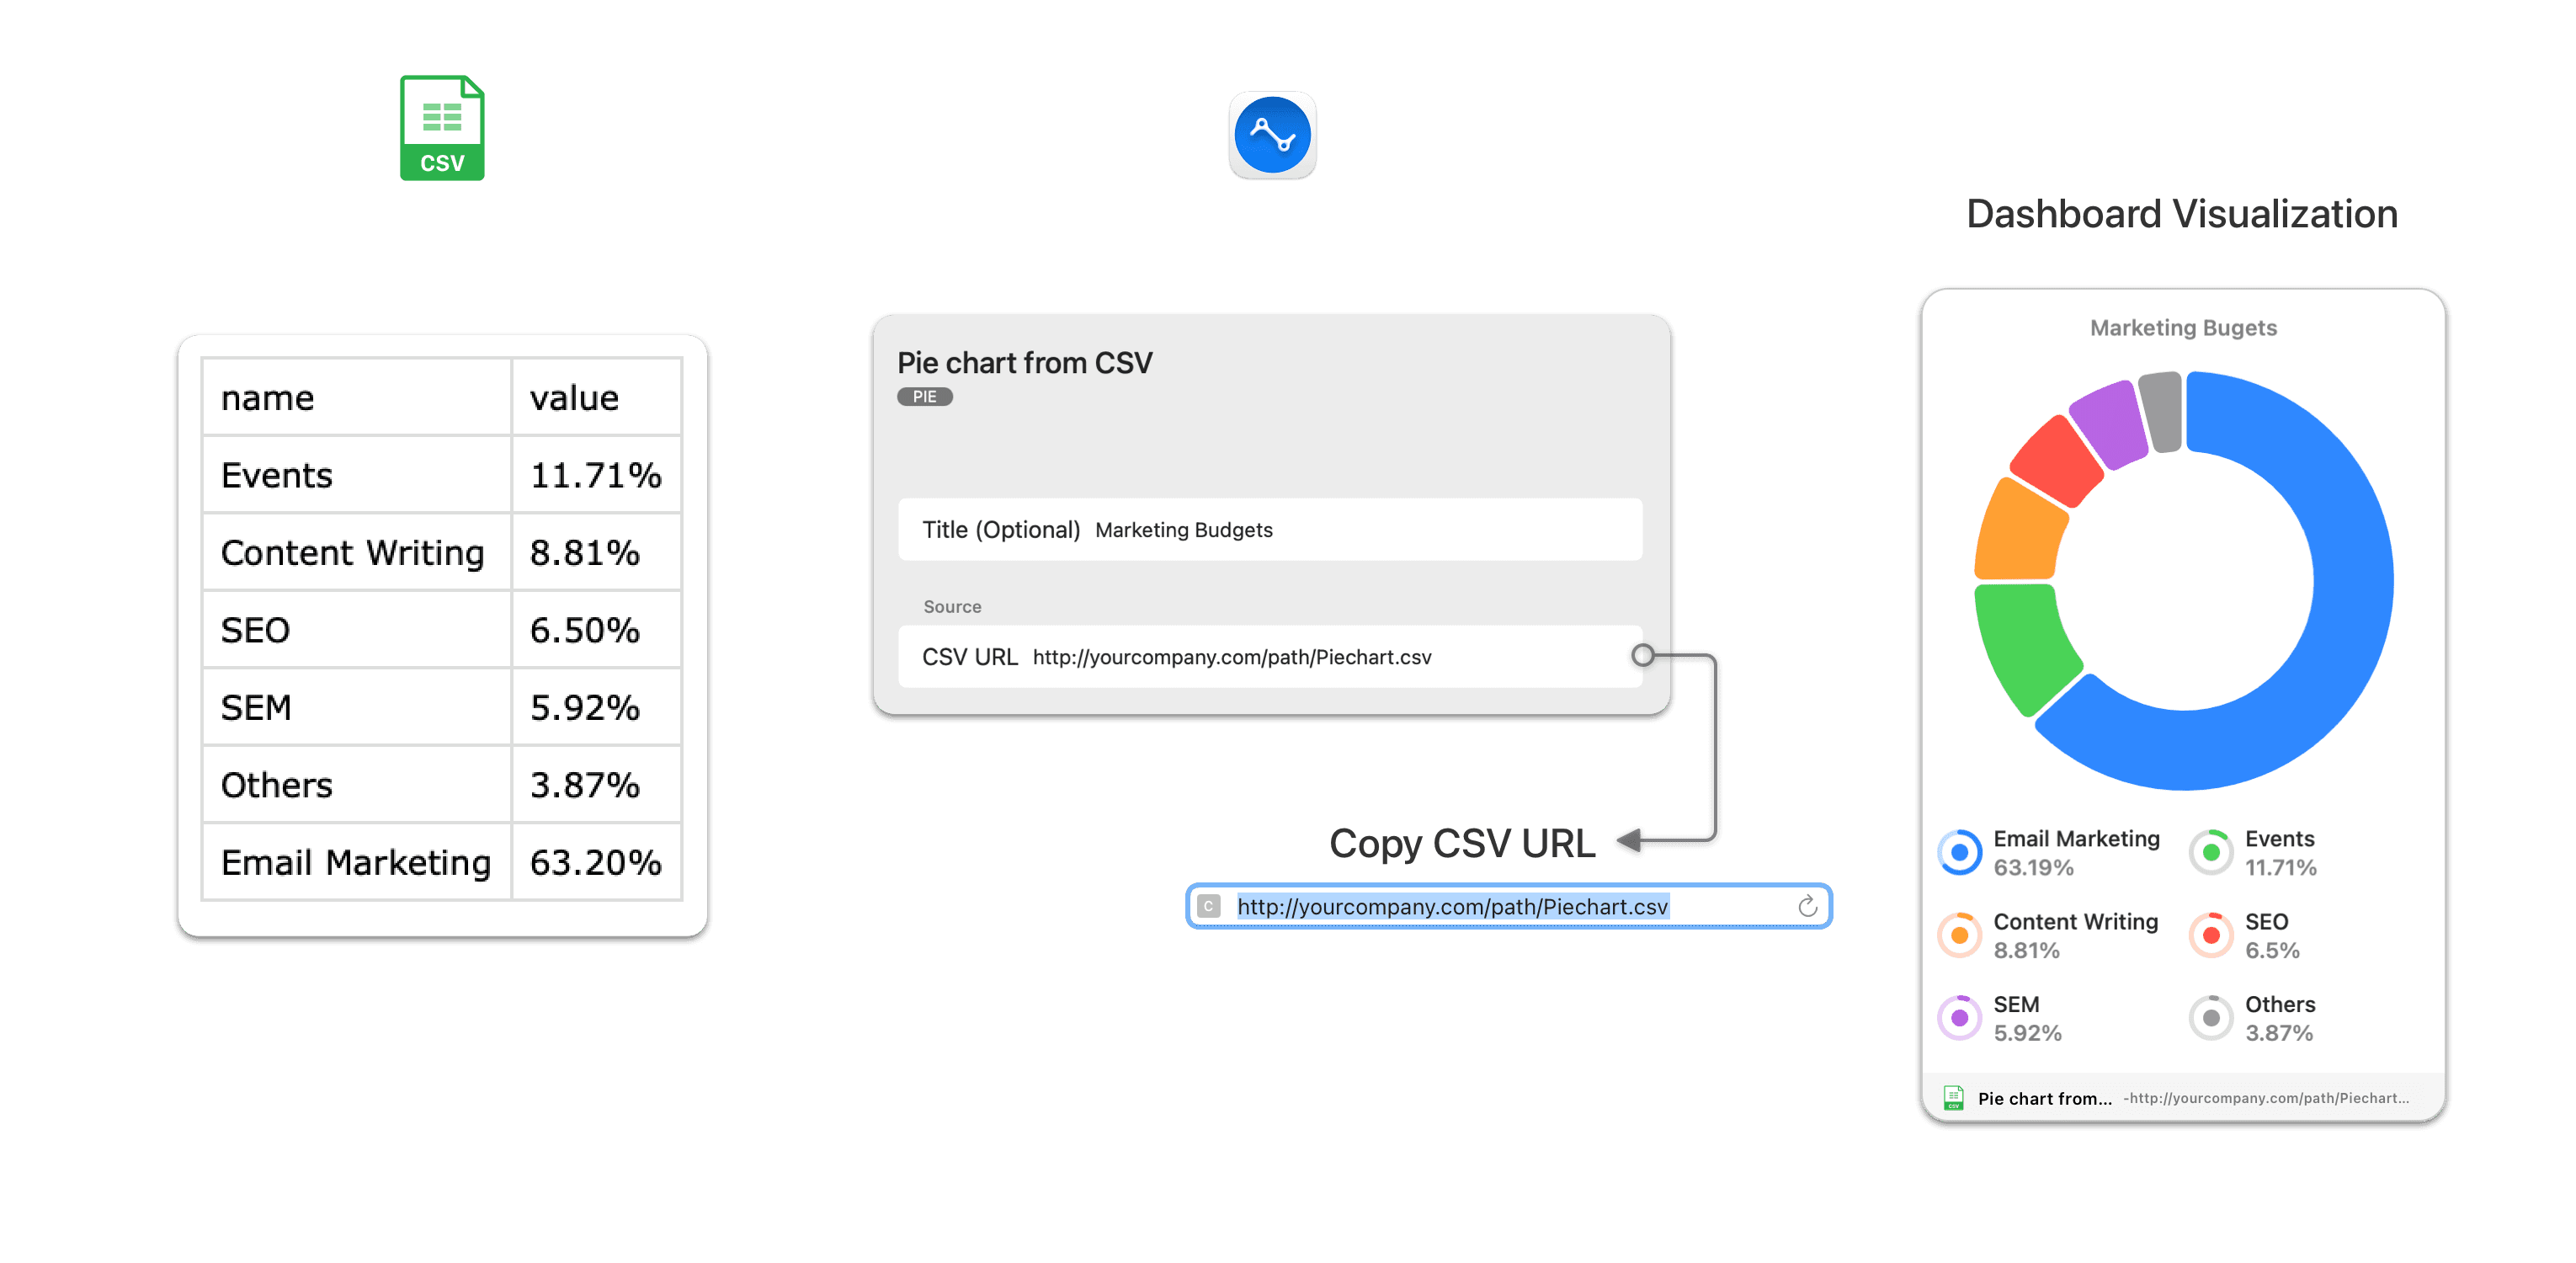
CSV Custom Pie
Following is the Widget Data Spec for a pie chart widget:
name,value
Rafael,386
Walter,9999
Chang,774
Lyndon,734
Ezequiel,818
The first column header name must be name and the second column header name must be value. The first column must have the names for which the values are provided and can be any formate including text, while the second column must have the values that used to form the slices of the pie. The pie chart automatically calculates the percentage value of each part of the pie, takes the top 5 values to draw 5 slices of the pie. If there are more than 5 values, the remaining values are added up to create the 6th slice named ‘Other’. The values are settable by your system but the column header names must be named as above.
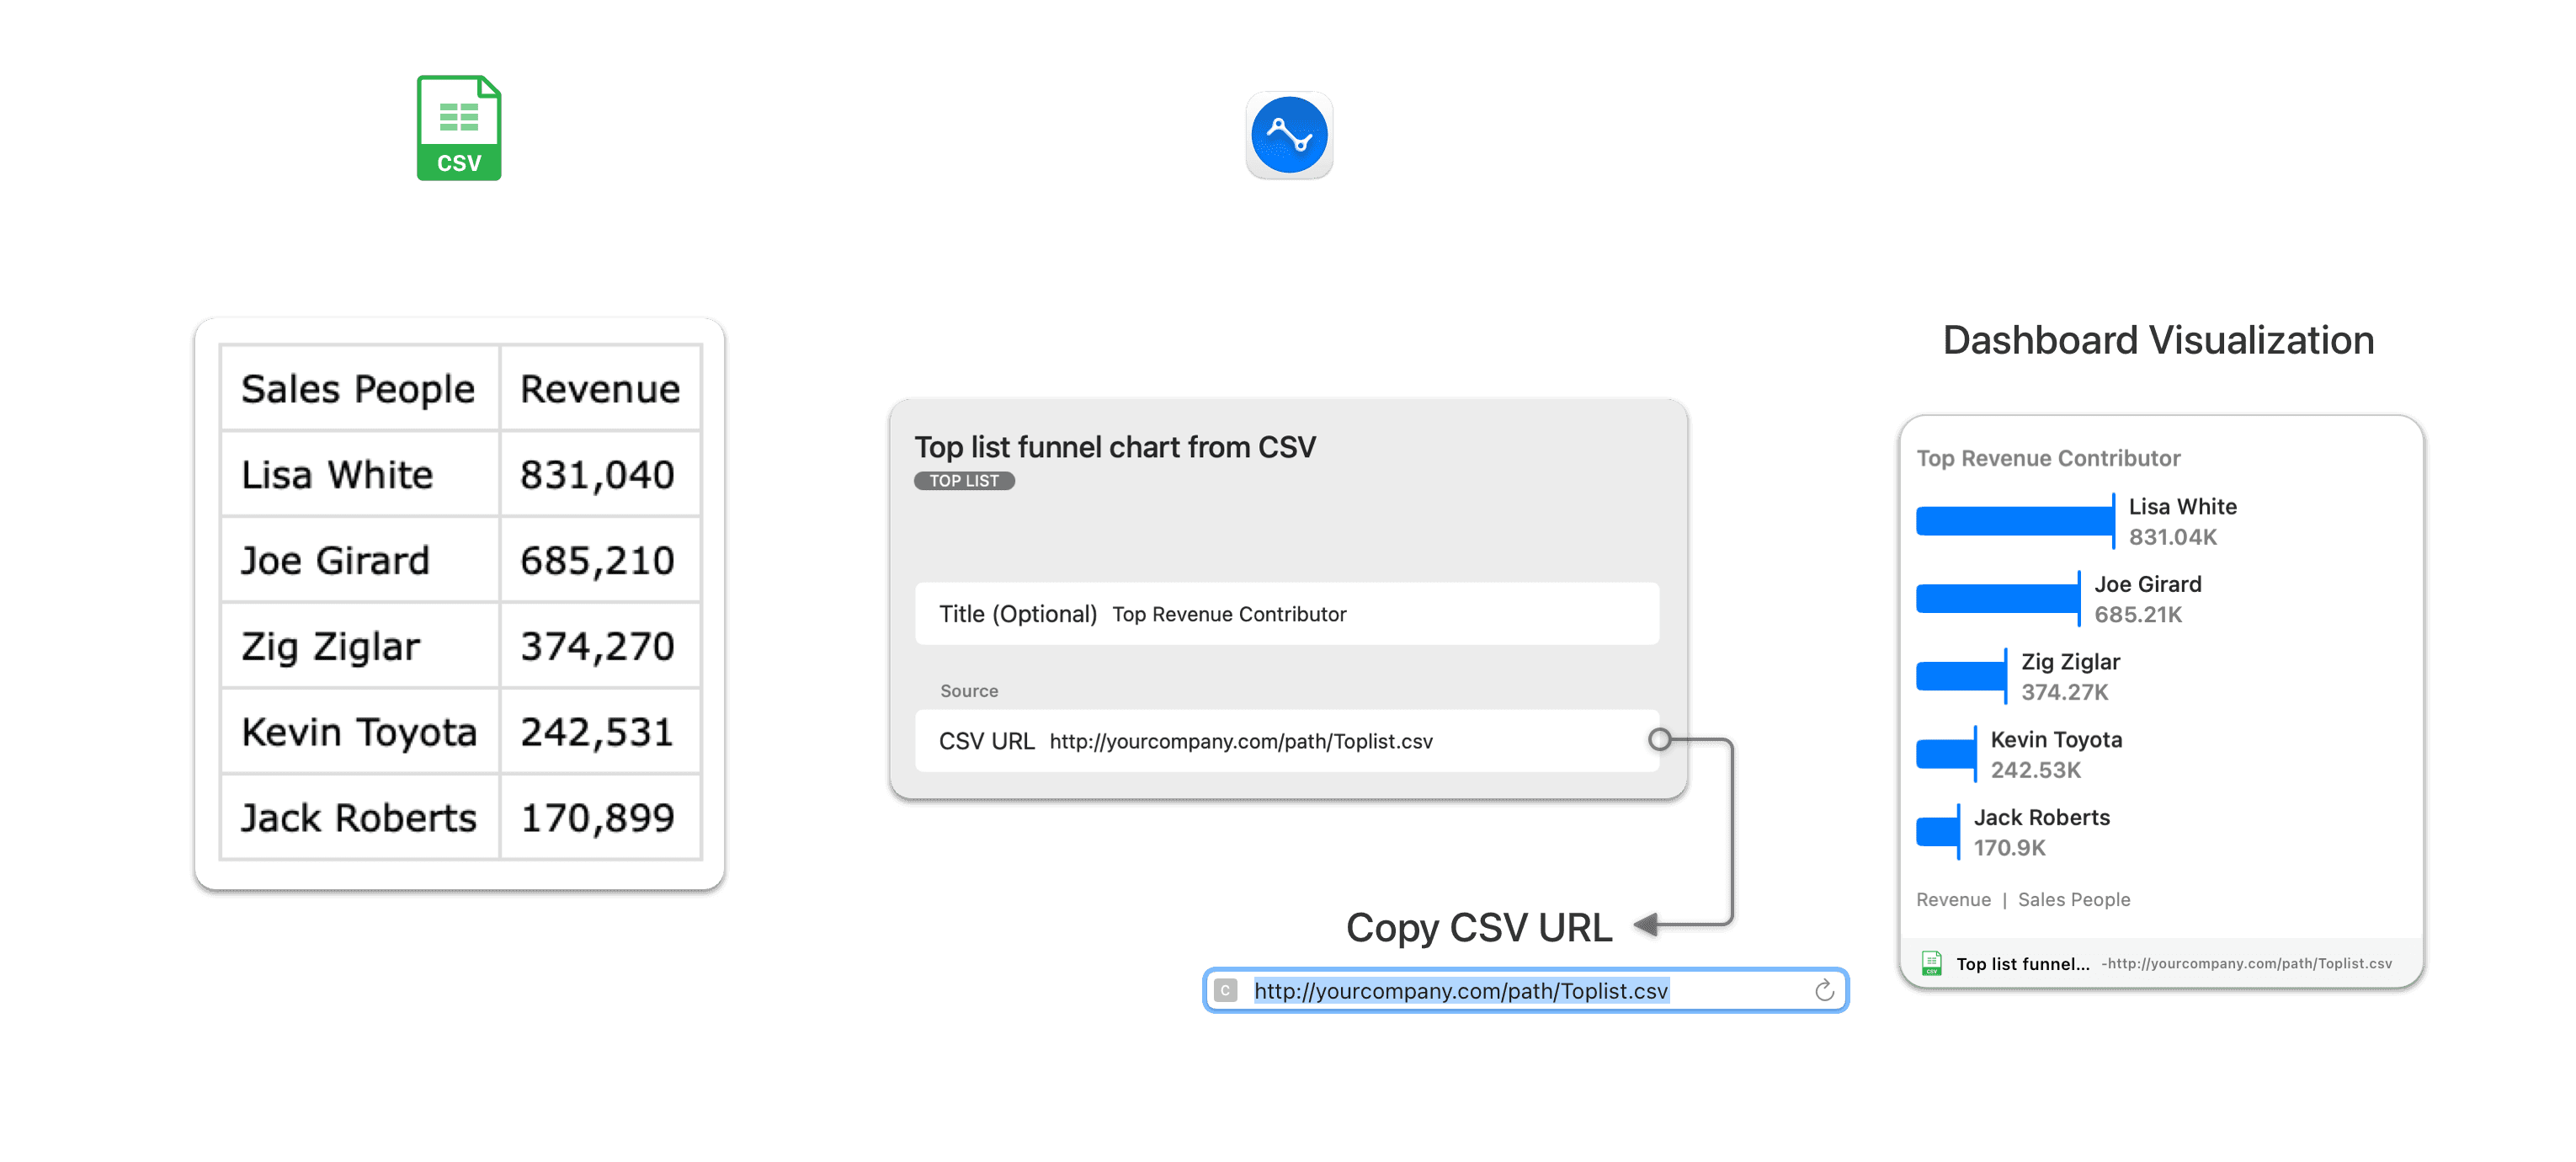
CSV Custom Top List
Following is the Widget Data Spec for a top list funnel widget:
Countries,Sales
Rafael,386
Walter,9999900.65
Chang,774
Jimmie,264
Noah,407
The first and second column header names will be displayed as the postfix (units) for the two sides of the top list. The first column must have the names for which the values are provided and can be any format including text, while the second column must have the values that used to form the funnel chart. The top list funnel chart will automatically sort and pick up the top 5 items from the values to draw the top list. Both, the values are settable by your system.
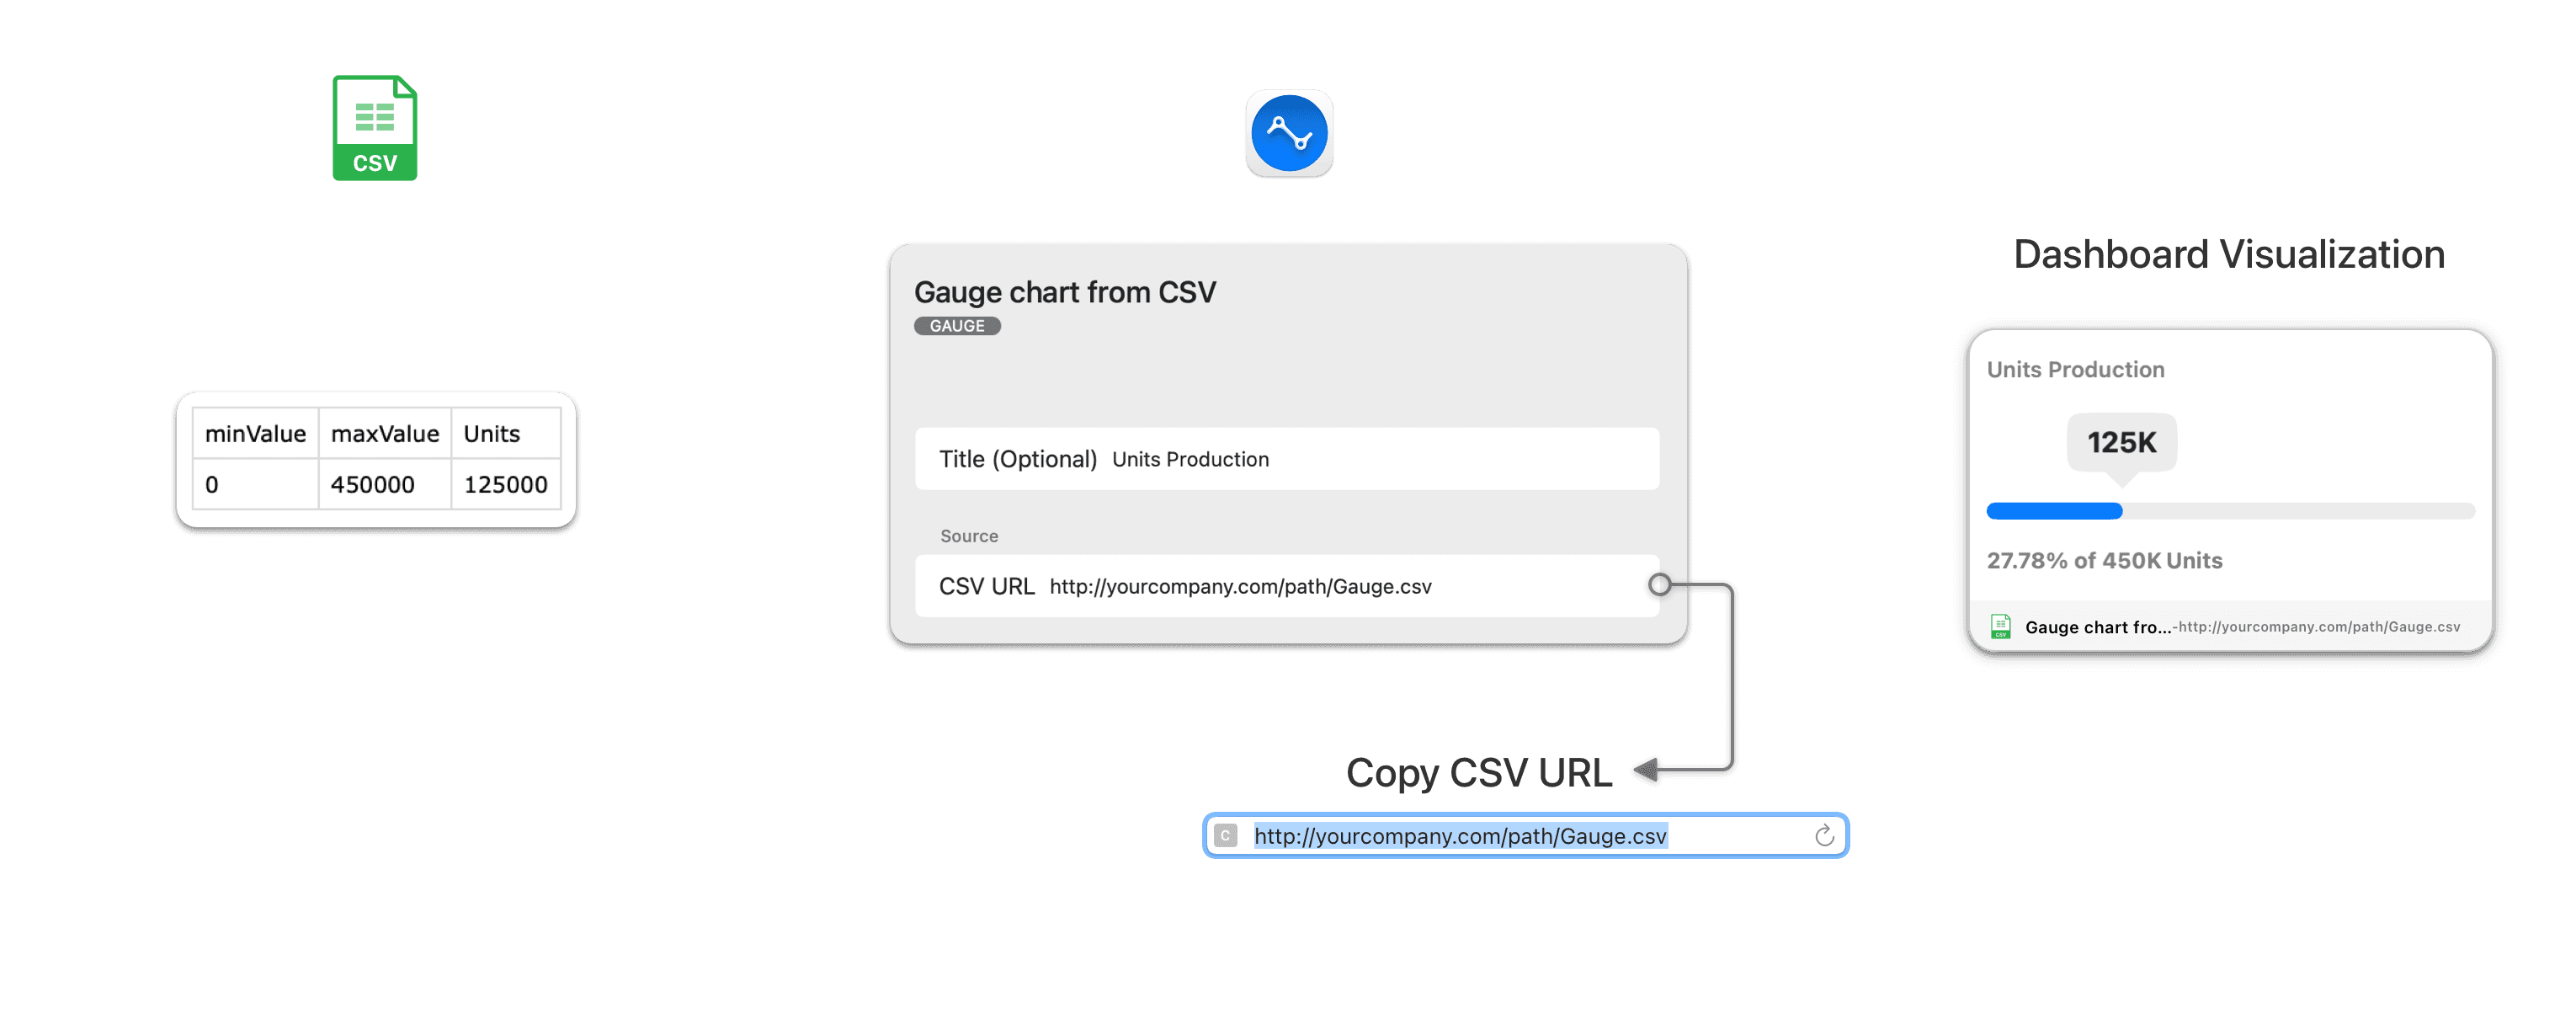
CSV Custom Gauge
Following is the Widget Data Spec for a gauge widget:
minValue,maxValue,Sales
0,230,350
The values for the first and third columns i.e. minValue & maxValue are used to form the start and end values of the gauge. The value of the second column is displayed as the current status on the gauge and its column header is displayed as the postfix.
CSV Custom Timer
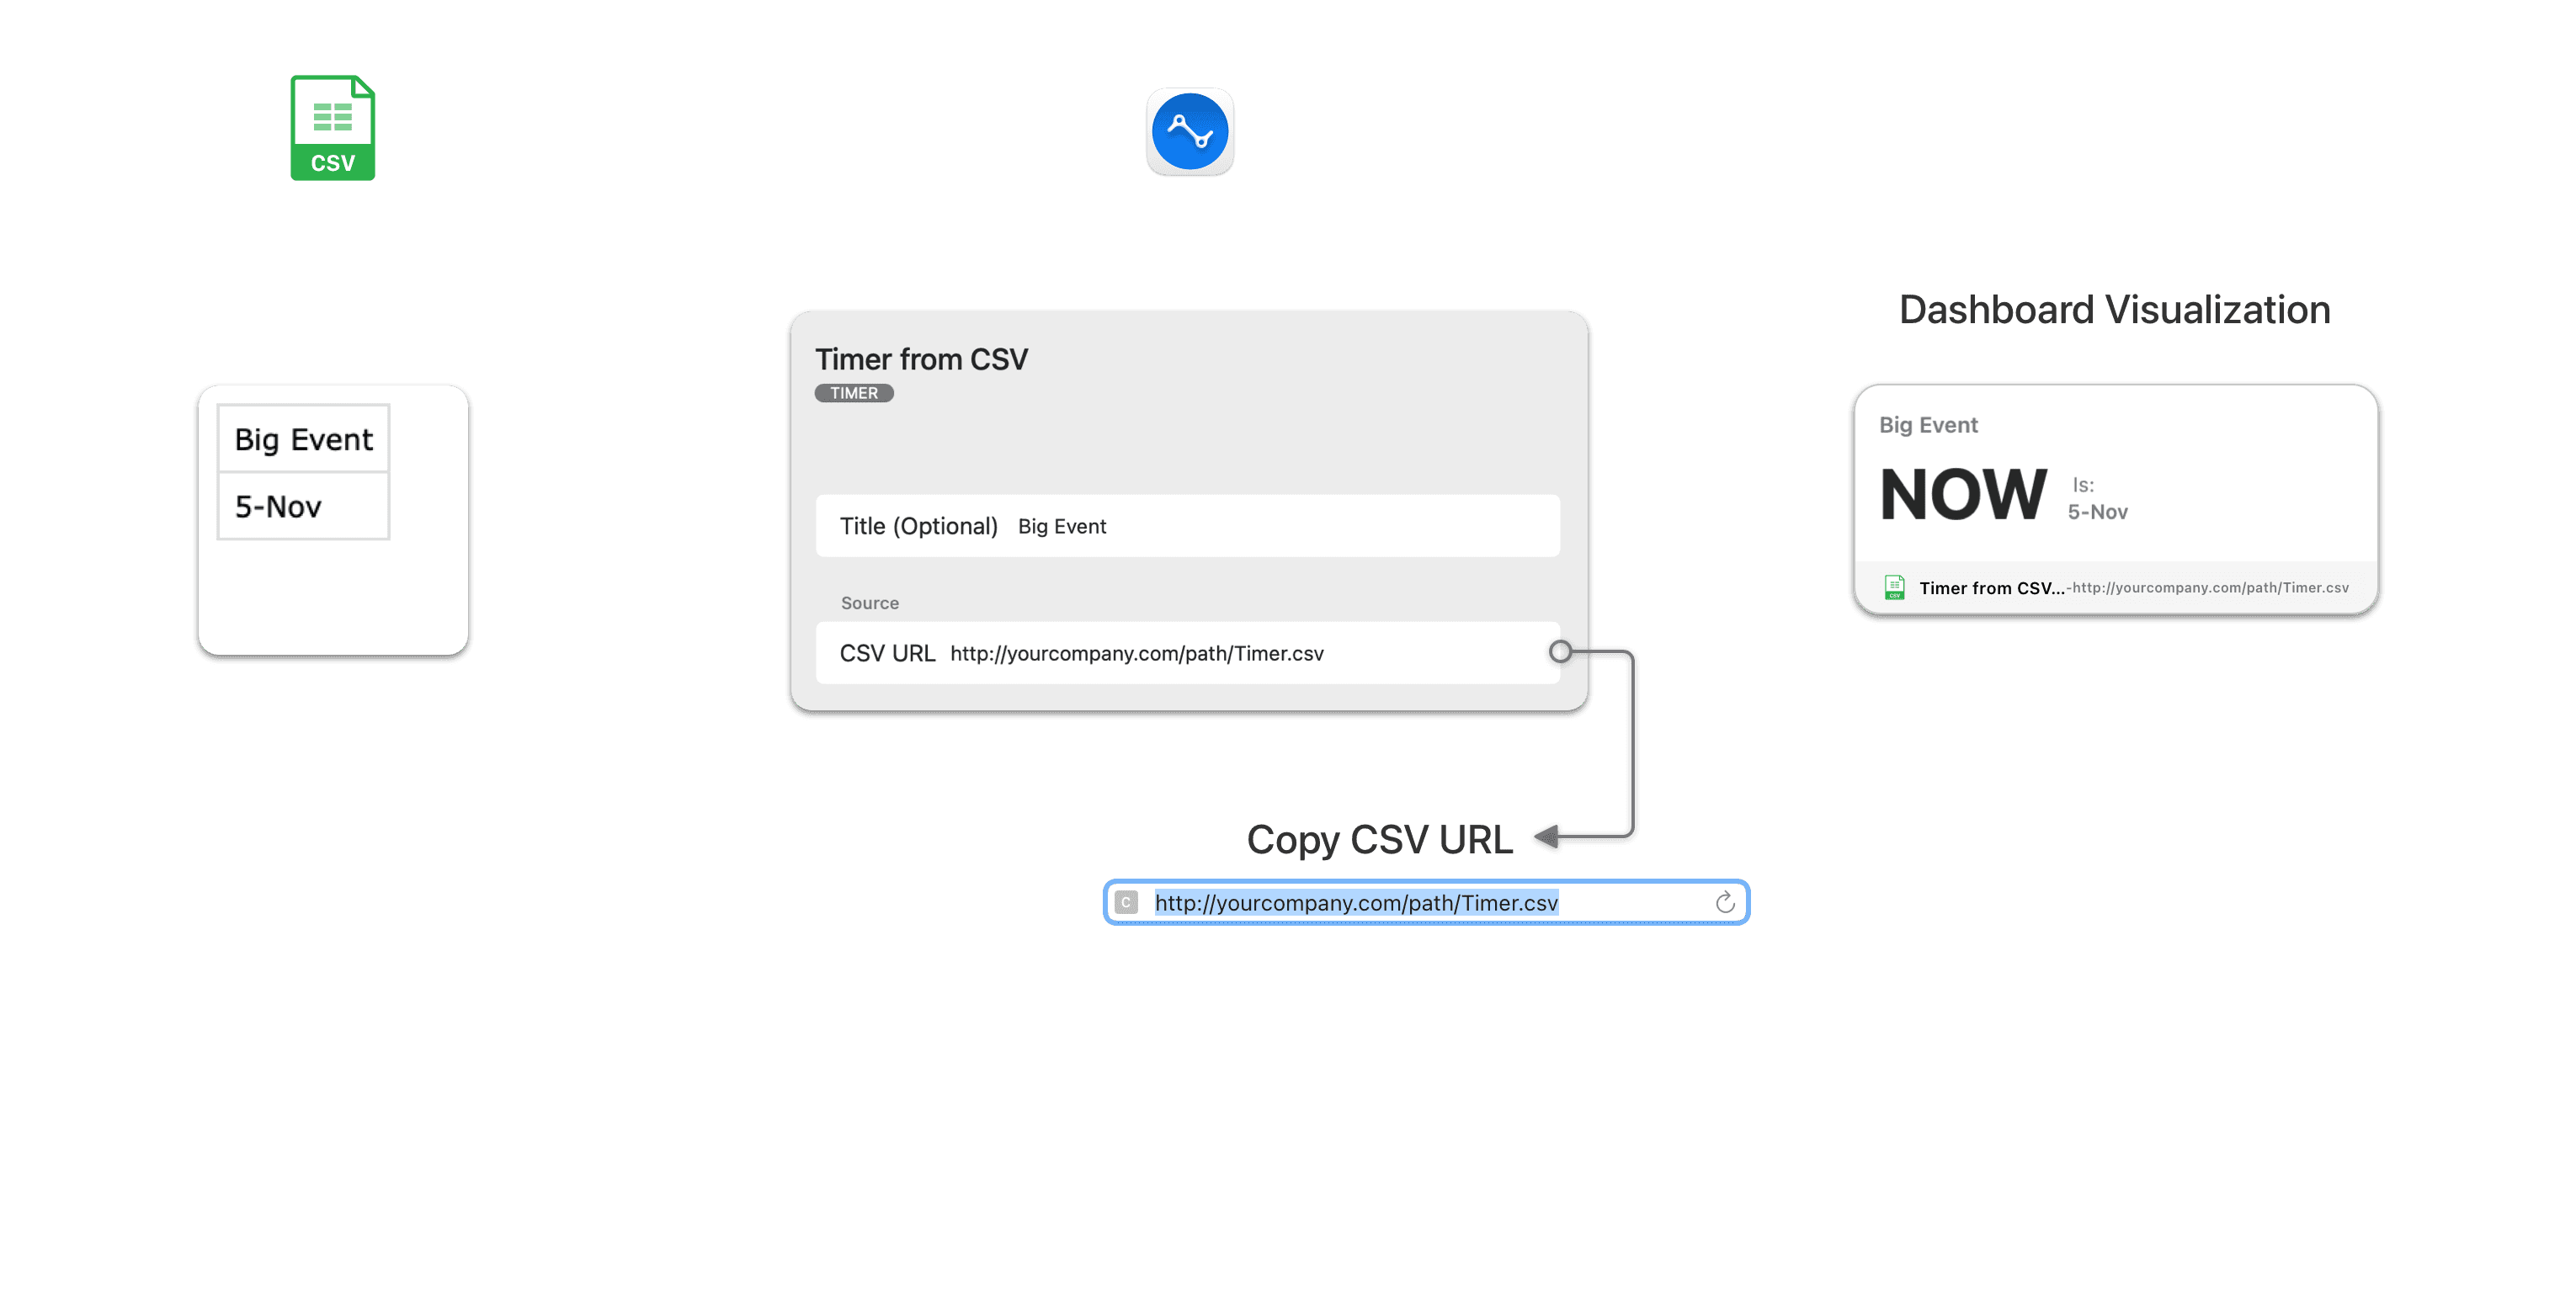
Following is the Widget Data Spec for a timer widget:
Big Launch
2020-01-01
The column header name of the first row is displayed as the event name and the date in the second row is automatically converted to a timer counting down to it.