

Connect Amazon API Gateway to custom JSON
Create dashboards from custom JSON data in Amazon AWS with Amazon API Gateway
Users hosting their business software on Amazon AWS can use the Amazon API Gateway to create an API for their custom software and connect it with Numerics to track their metrics. Numerics can connect to any compatible custom JSON via the Amazon API gateway protected with API Key based authentication. Similar to the Custom JSON integration in Numerics, the Amazon API gateway widgets require you to enter a JSON URL accessible by Numerics. The JSON data must be formatted as per the Numerics Widget Data Specification.
Examples for each widget type are shared below. Your JSON output should be precisely formatted as in the examples. The values are settable by your system but the keys must be named as in the examples. Once the JSON data is available, simply enter the entire URL to the JSON data into the path field. e.g. http://yourcompany.com/path/to/data.json.
Please Note: You must specify the full URL to your JSON data, including the ‘http://’ or ‘https://’ parts of the URL for the source.
Label from JSON data:
Following is the Widget Data Spec for a label widget:
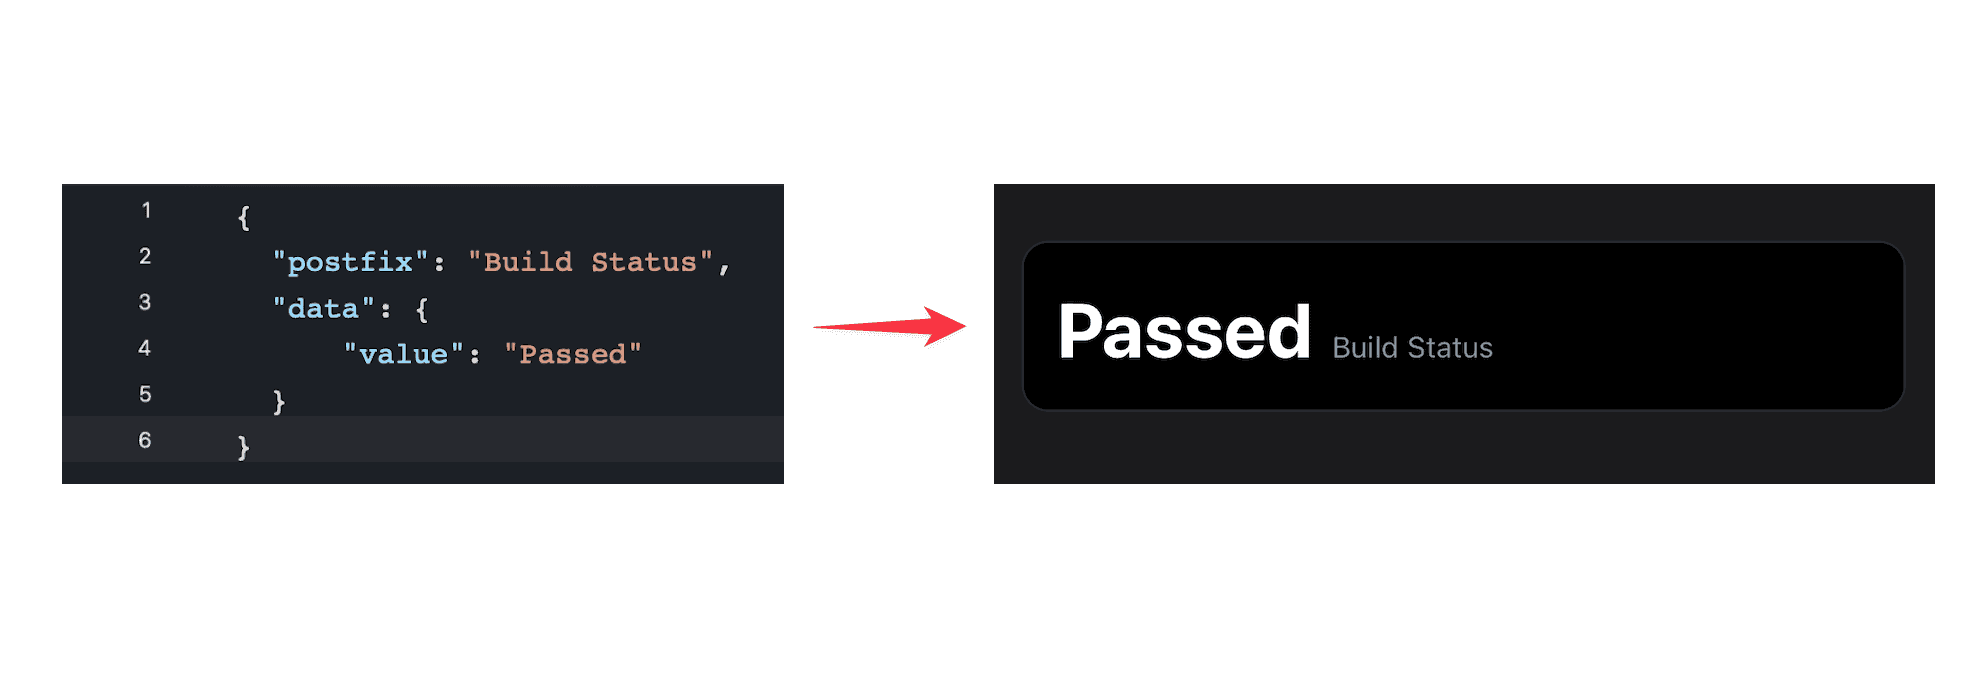
The values are settable by your system but the keys must be named as above. If the JSON is formatted correctly, the widget should show a text label from the JSON data.
{
"postfix": "Build Status",
"data": {
"value": "Passed"
}
}
Number from JSON data:
Following is the Widget Data Spec for a simple number widget:
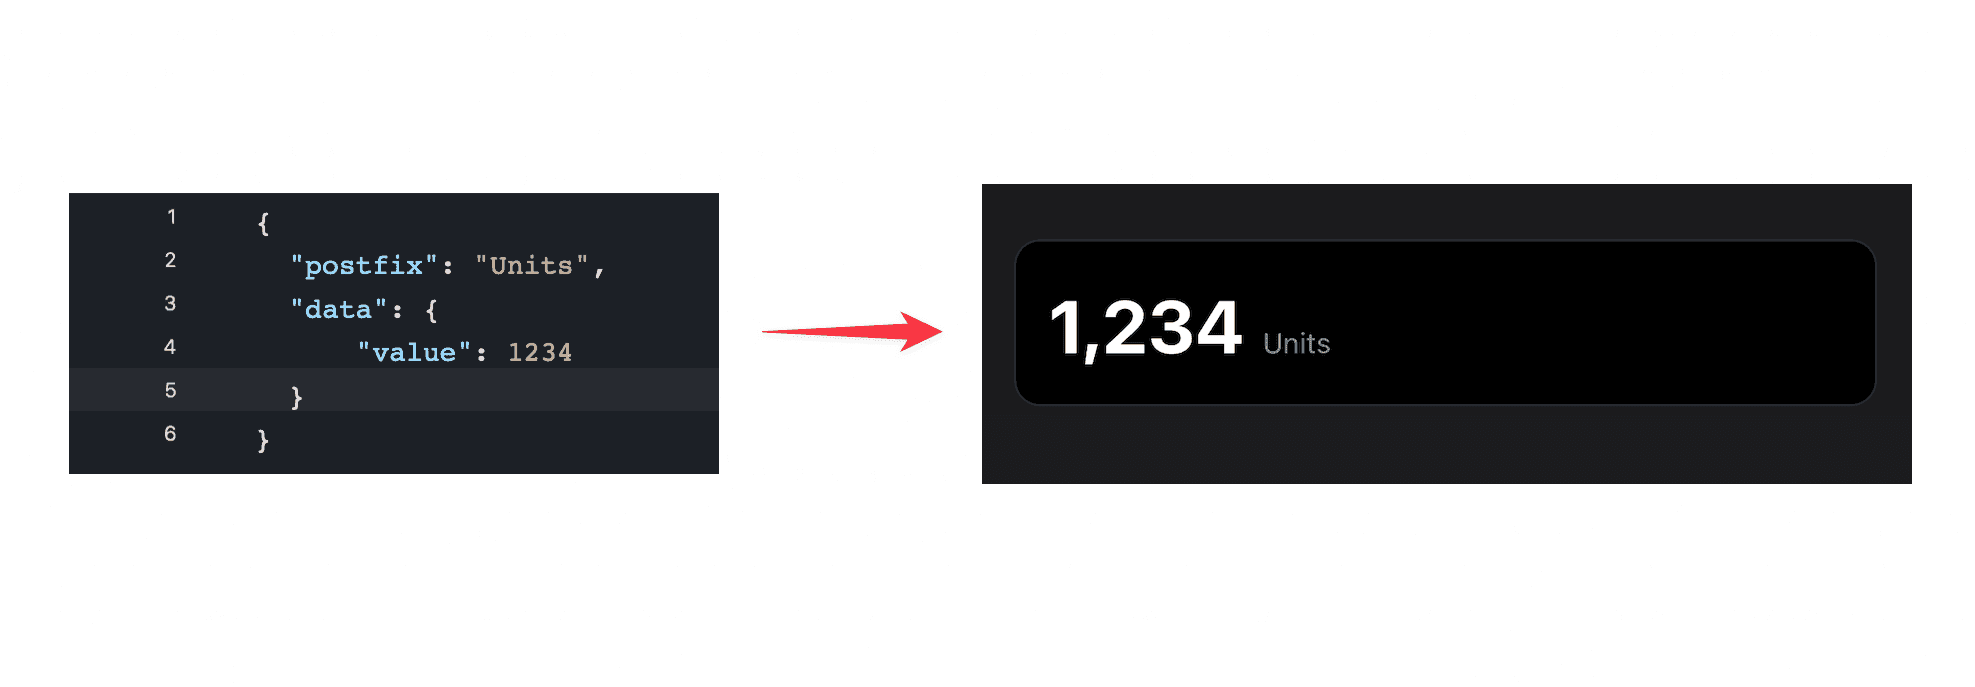
The values are settable by your system but the keys must be named as above. If the JSON is formatted correctly, the widget should show a number from the JSON data.
{
"postfix": "Units",
"data": {
"value": 1234
}
}
Count and difference indicator from JSON data
Following is the Widget Data Spec for a number with change indicator widget:
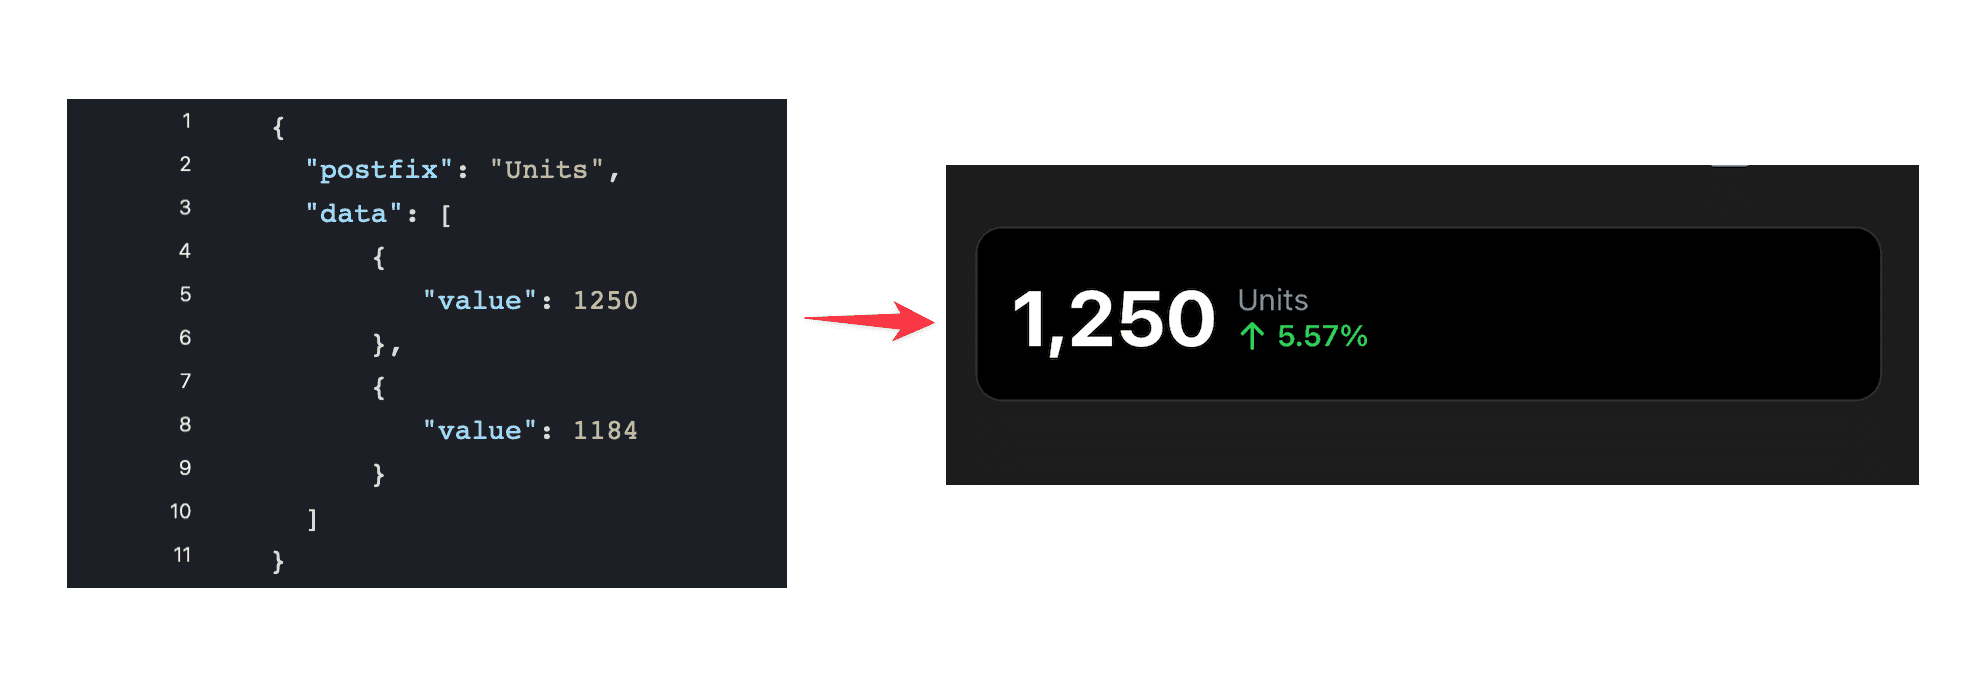
The first value is the actual number to be displayed while the second value is the number from the previous period that is used to calculate the change or difference percentage. The values are settable by your system but the keys must be named as above. If the JSON is formatted correctly, the widget should show a number with a percentage change indicator from the JSON data.
{
"postfix": "Units",
"data": [
{
"value": 1250
},
{
"value": 1184
}
]
}
Line graph from JSON data
Following is the Widget Data Spec for a line graph widget:
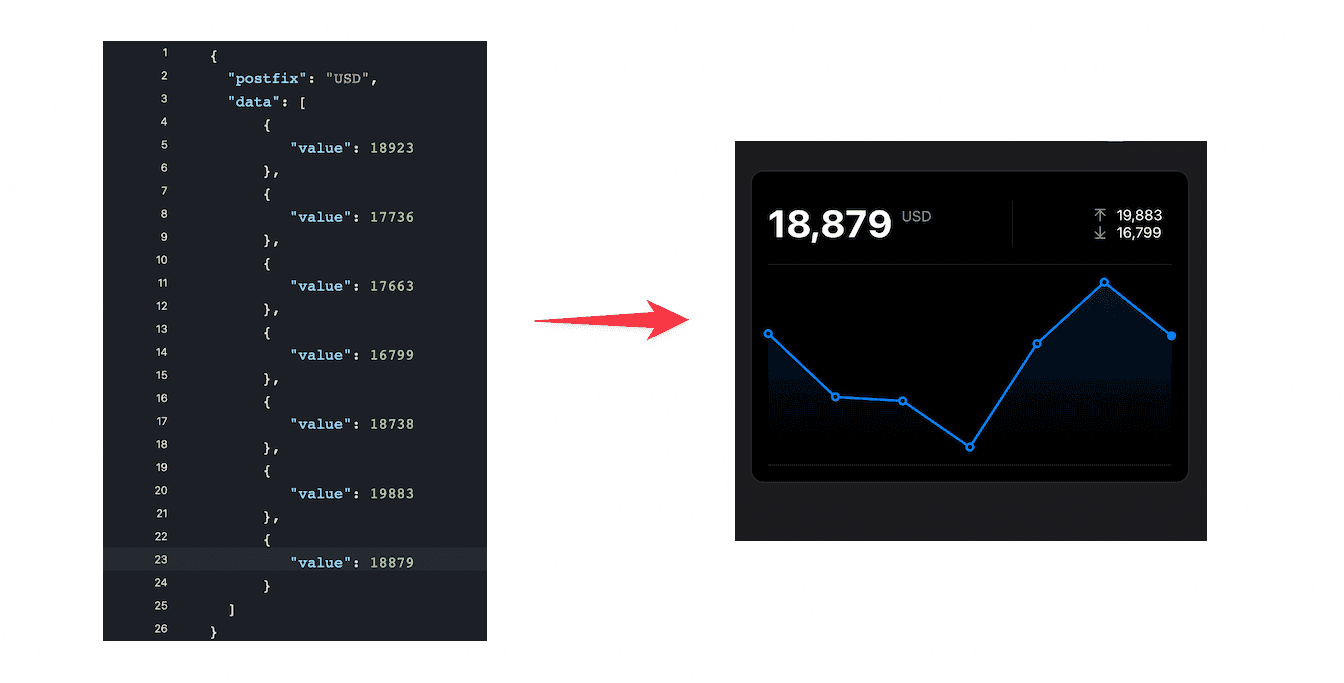
The data array can contain a maximum of 31 items. The values are settable by your system but the keys must be named as above. If the JSON is formatted correctly, the widget should show a line graph from the JSON data.
{
"postfix": "USD",
"data": [
{
"value": 18923
},
{
"value": 17736
},
{
"value": 17663
},
{
"value": 16799
},
{
"value": 18738
},
{
"value": 19883
},
{
"value": 18879
}
]
}
Named line graph from JSON data
Following is the Widget Data Spec for a named line graph widget:
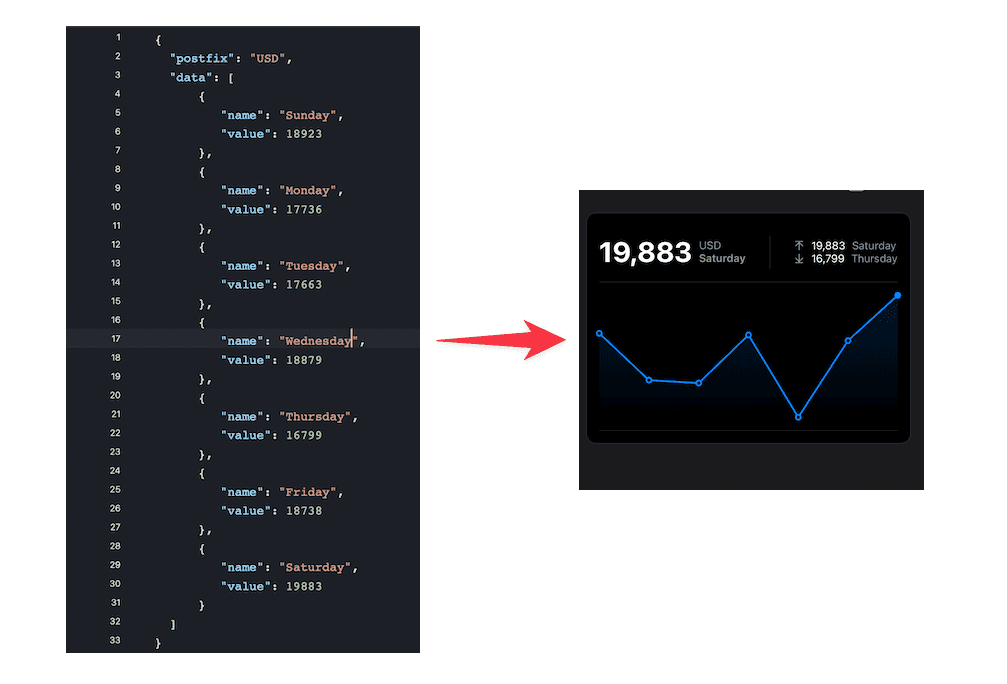
The data array can contain a maximum of 31 items. The values are settable by your system but the keys must be named as above. If the JSON is formatted correctly, the widget should show a named line graph from the JSON data.
{
"postfix": "USD",
"data": [
{
"name": "Sunday",
"value": 18923
},
{
"name": "Monday",
"value": 17736
},
{
"name": "Tuesday",
"value": 17663
},
{
"name": "Wednesday",
"value": 16799
},
{
"name": "Thursday",
"value": 18738
},
{
"name": "Friday",
"value": 19883
},
{
"name": "Saturday",
"value": 18879
}
]
}
Pie chart from JSON data
Following is the Widget Data Spec for a pie chart widget:
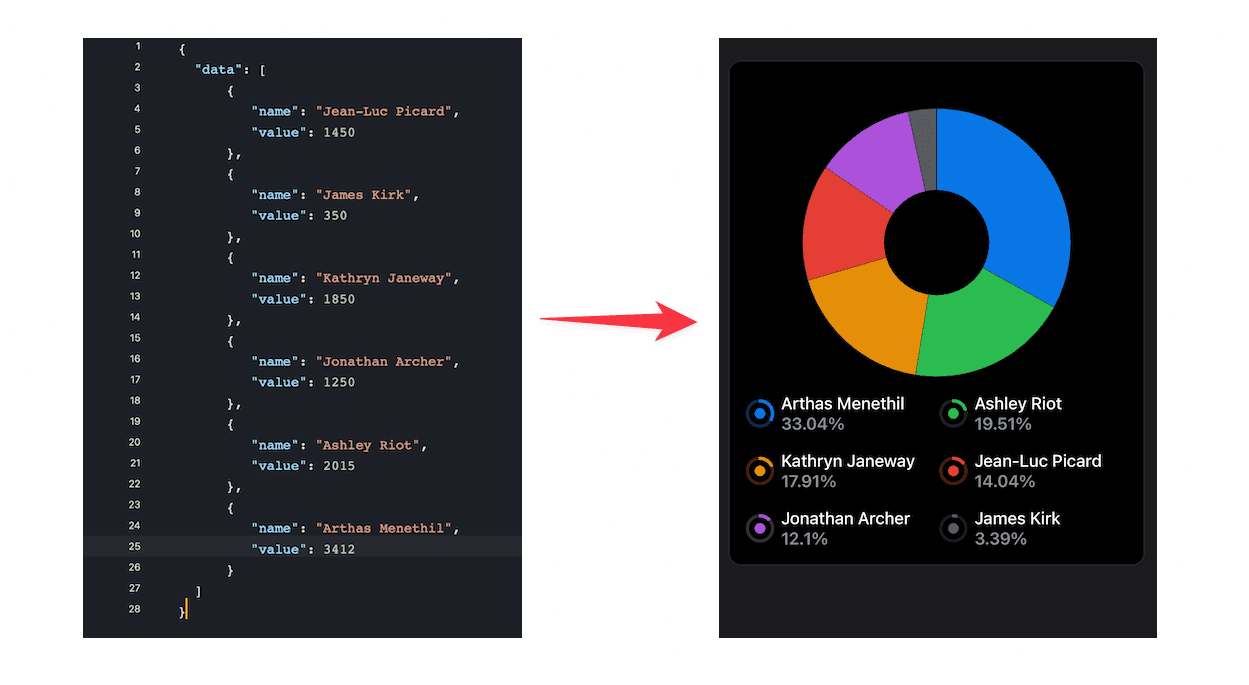
The top 5 items will be chosen to draw the pie slices and the rest will be added to one slice called other. The values are settable by your system but the keys must be named as above. If the JSON is formatted correctly, the widget should show a pie chart from the JSON data.
{
"data": [
{
"name": "Jean-Luc Picard,
"value": 1450
},
{
"name": "James Kirk",
"value": 350
},
{
"name": "Kathryn Janeway",
"value": 1850
},
{
"name": "Jonathan Archer",
"value": 1250
},
{
"name": "Ashley Riot",
"value": 2015
},
{
"name": "Arthas Menethil",
"value": 3412
}
]
}
Top list funnel chart from JSON data
Following is the Widget Data Spec for a top list funnel widget:
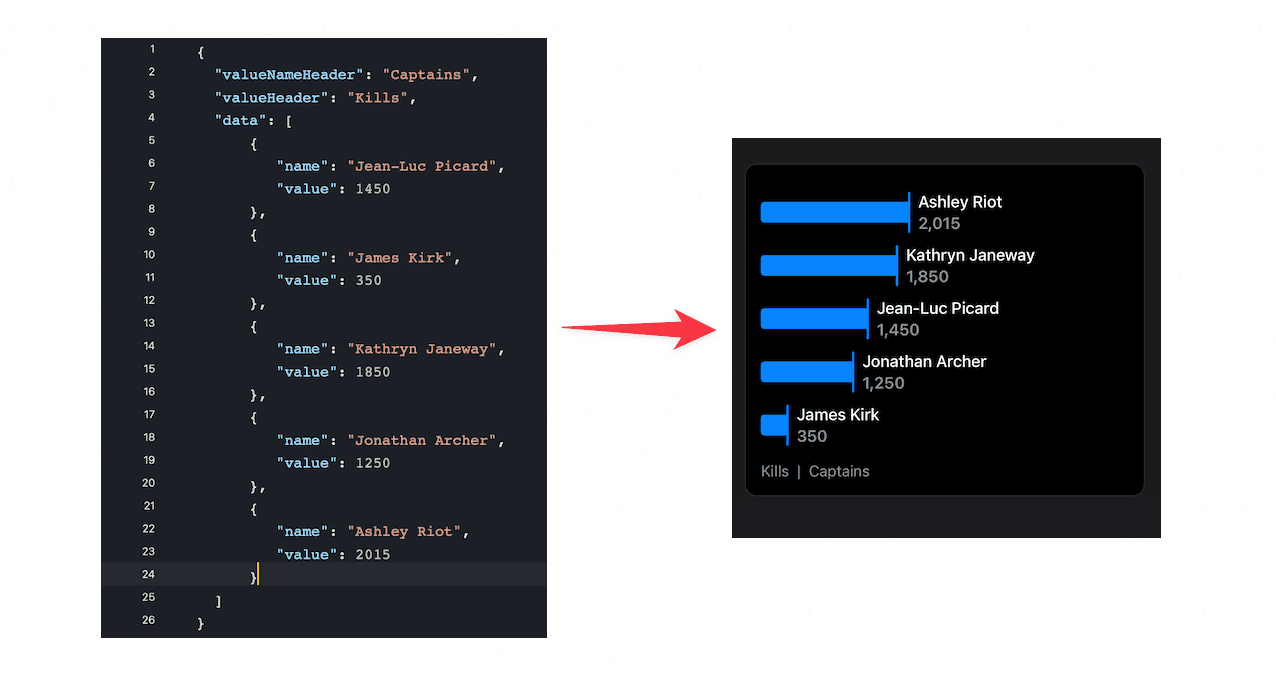
The top 5 items will be chosen to draw the top list. The values are settable by your system but the keys must be named as above. If the JSON is formatted correctly, the widget should show a top list funnel chart from the JSON data.
{
"valueNameHeader" : "Captains"
"valueHeader" : "Kills"
"data": [
{
"name": "Jean-Luc Picard,
"value": 1450
},
{
"name": "James Kirk",
"value": 350
},
{
"name": "Kathryn Janeway",
"value": 1850
},
{
"name": "Jonathan Archer",
"value": 1250
},
{
"name": "Ashley Riot",
"value": 2015
}
]
}
Gauge from JSON data
Following is the Widget Data Spec for a gauge widget:
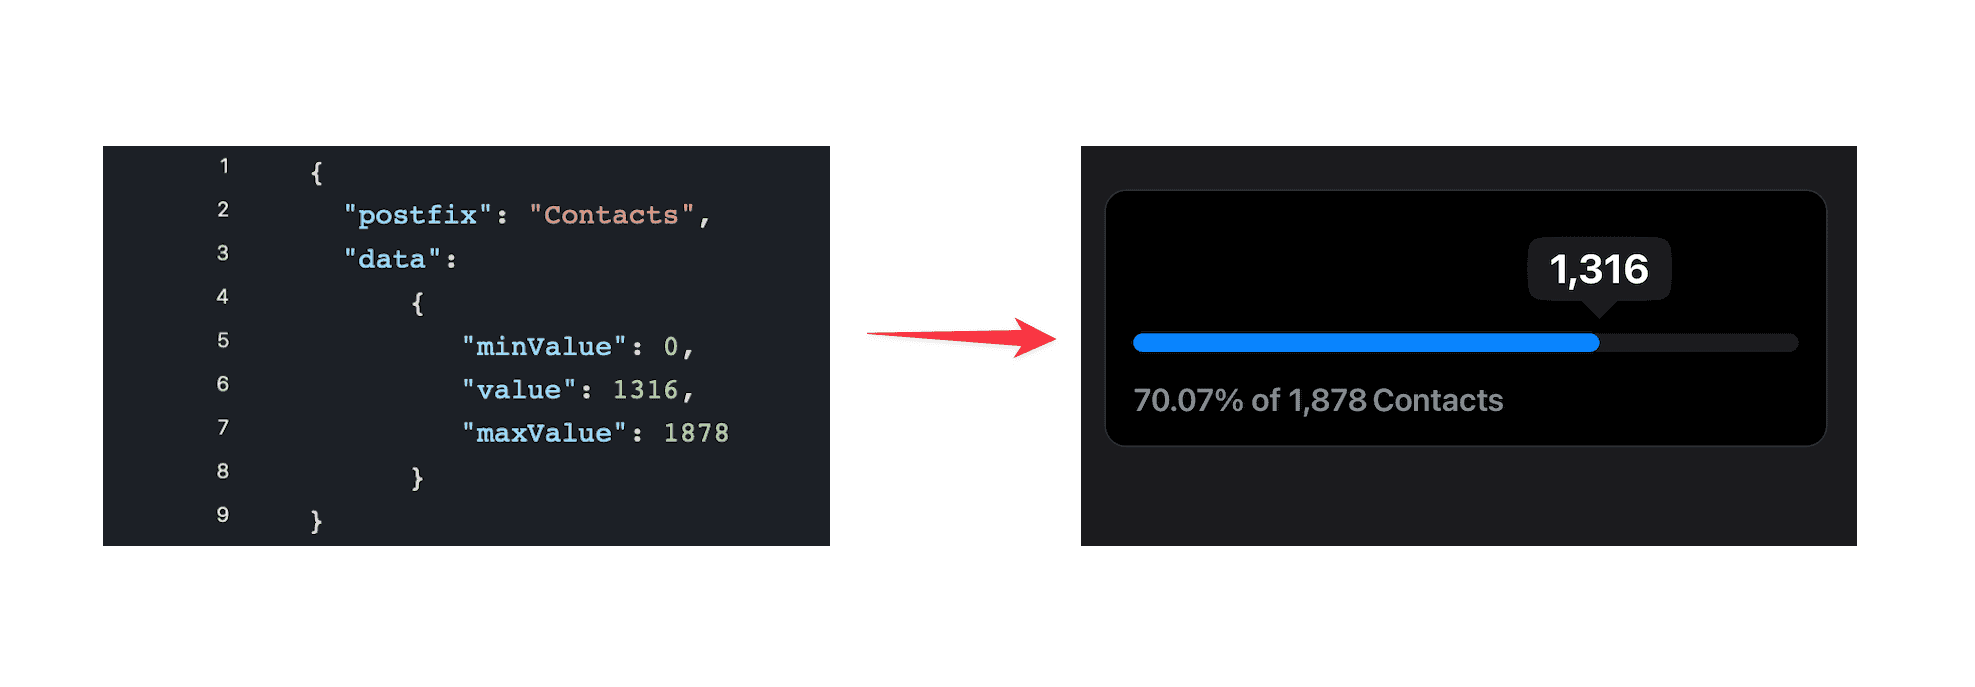
If the JSON is formatted correctly, the widget should show a gauge from the JSON data.
{
"postfix": "Contacts",
"data": {
"minValue": 0,
"value": 1316,
"maxValue": 1878
}
}
Timer from JSON data
Following is the Widget Data Spec for a timer widget:
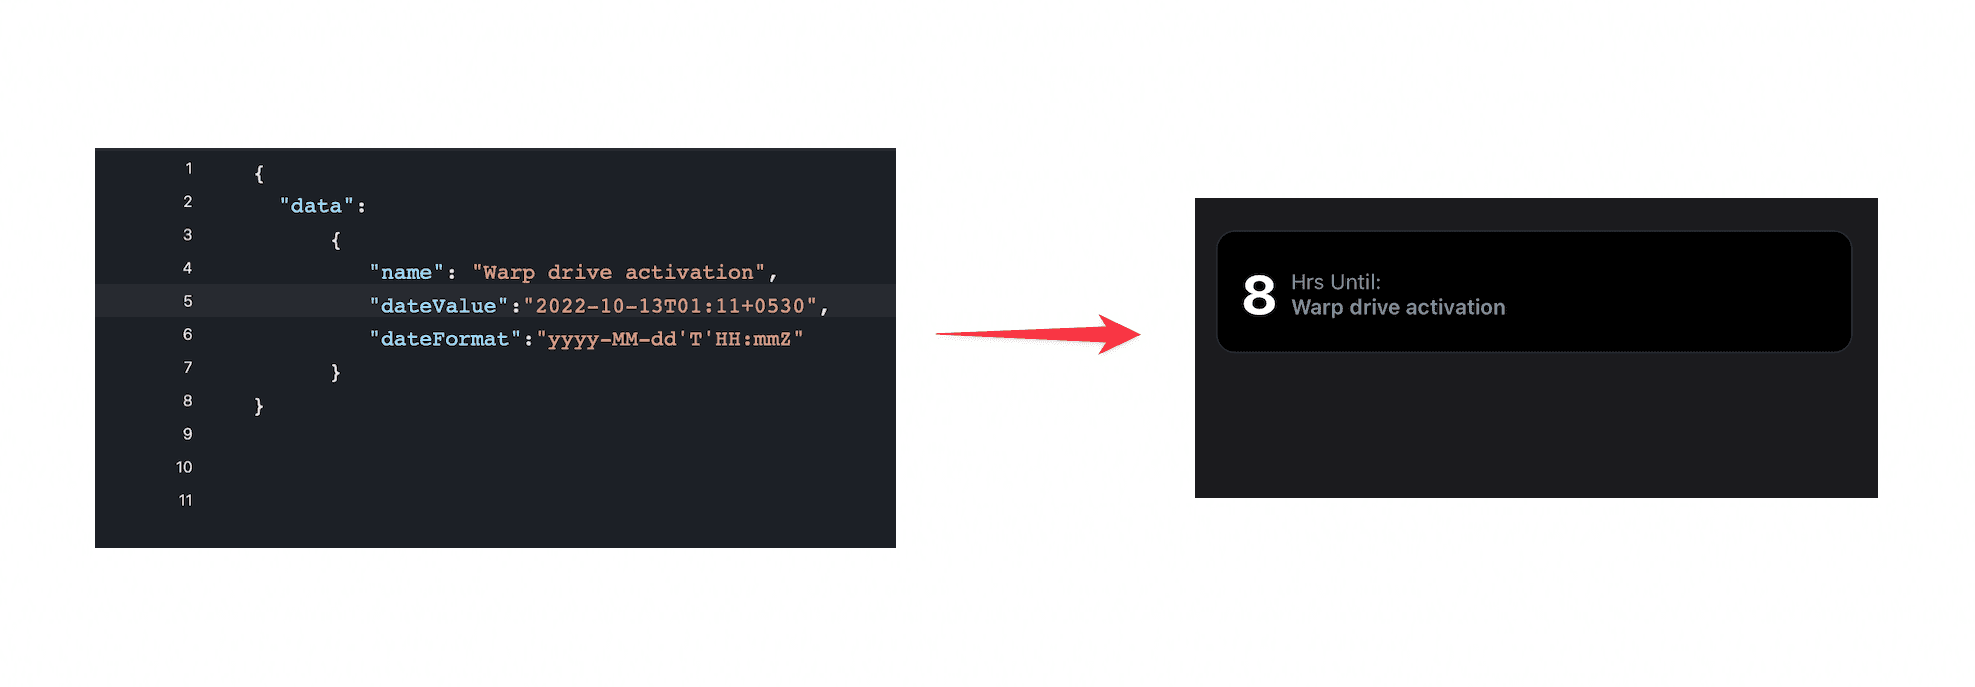
If the JSON is formatted correctly, the widget should show a timer from the JSON data counting down to the date: 21st December 2020 and the event name Warp drive activation will be displayed below the countdown.
{
"data": {
"name": "Warp drive activation",
"dateValue": "2022-10-13T01:11+0530",
"dateFormat": "yYYY-MM-dd'T 'HHsmmz"
}
}
Hour density chart from JSON data
Following is the Widget Data Spec for an hour density clock widget:
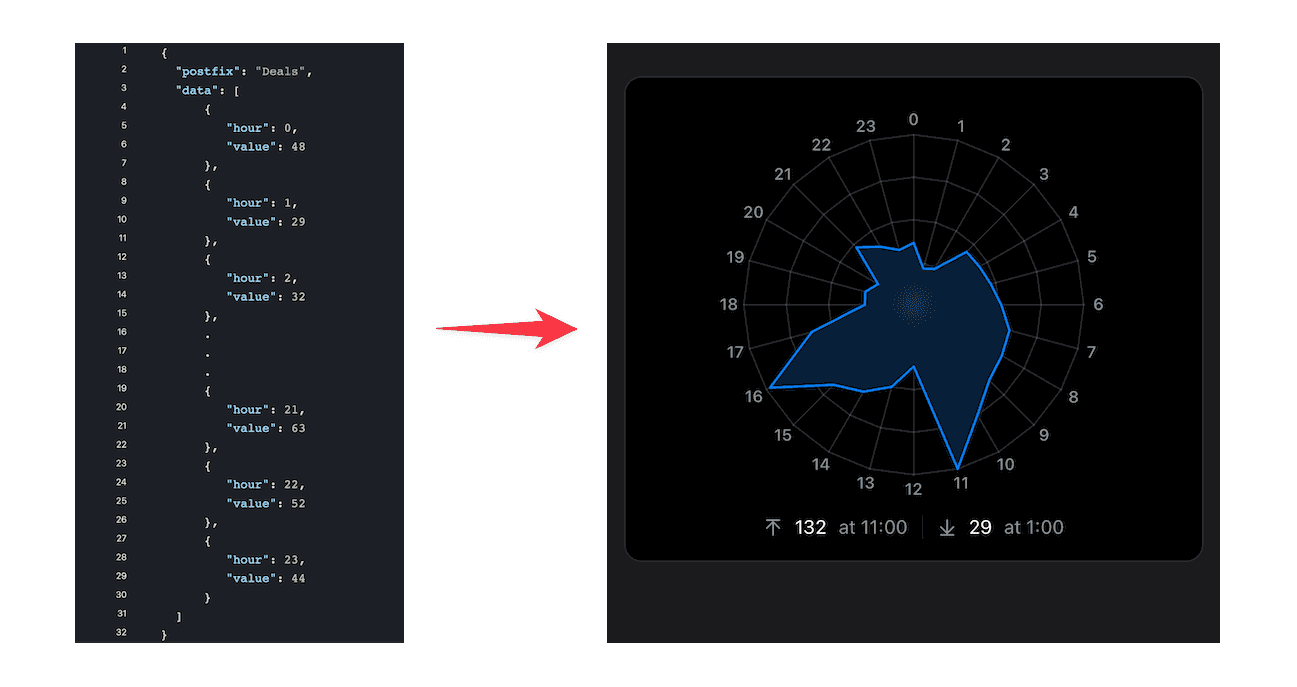
The data array must contain items for 24 hours for a single day. The values are settable by your system but the keys must be named as above. If the JSON is formatted correctly, the widget should show an hour density clock from the JSON data, starting at 00 and broken into 24 equal slices, with each slice of the pie representing an hour. Hours with the highest values are the brightest, while hours with lower values are incrementally more transparent and closer to the background color of the widget.
{
"postfix": "Deals",
"data": [
{
"hour": 0,
"value": 48
},
{
"hour": 1,
"value": 29
},
{
"hour": 2,
"value": 32
},
.
.
.
{
"hour": 21,
"value": 63
},
{
"hour": 22,
"value": 52
},
{
"hour": 23,
"value": 44
}
]
}
Day density chart from JSON data
Following is the Widget Data Spec for a day density calendar widget:
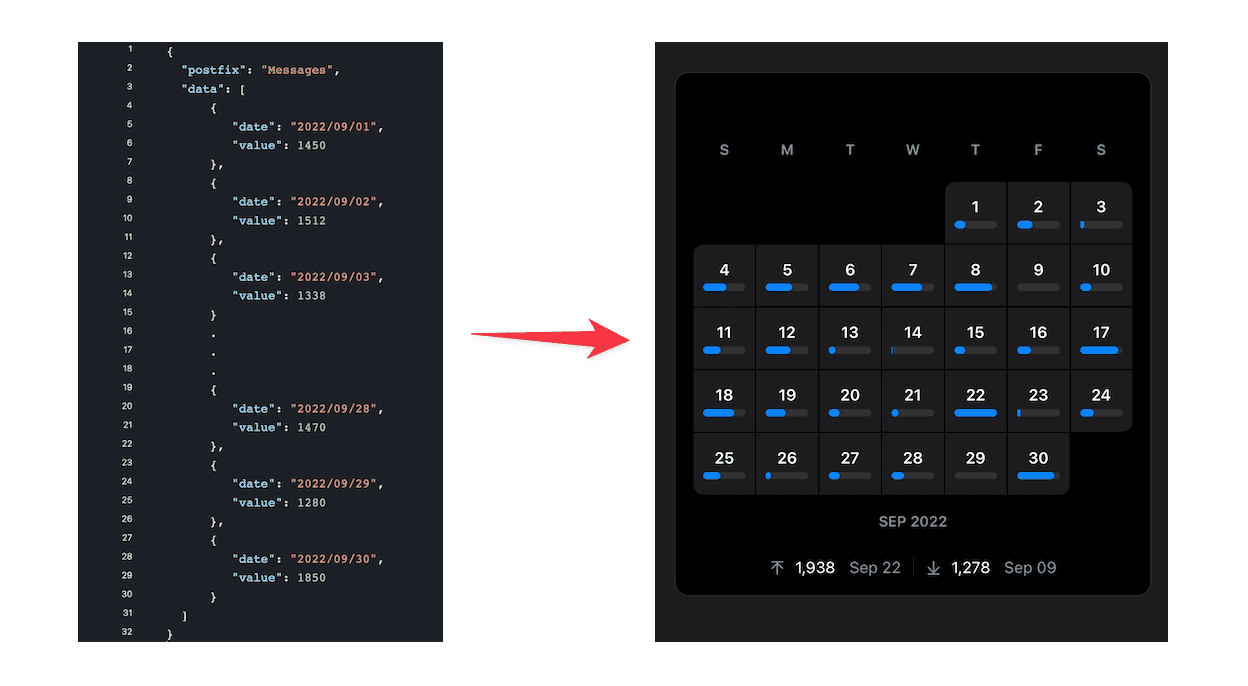
The data array must contain dates for a month. The values are settable by your system but the keys must be named as above. If the JSON is formatted correctly, the widget should show a day density calendar from the JSON data, with each block representing a day. Days with the highest values are the brightest, while days with lower values are incrementally more transparent and closer to the background color of the widget.
{
"postfix": "Messages",
"data": [
{
"date": "2022/09/01",
"value": 1450
},
{
"date": "2022/09/02",
"value": 1512
},
{
"date": "2022/09/03",
"value": 1338
},
.
.
.
{
"date": "2022/09/28",
"value": 1470
},
{
"date": "2022/09/29",
"value": 1280
},
{
"date": "2022/09/30",
"value": 1850
}
]
}