Google Spreadsheets
Design custom dashboards with data from Google Spreadsheets.
Numerics lets you easily display custom data from your Google Spreadsheets.
Once you’ve chosen the type of widget you want to add to your dashboard for Google Spreadsheets, you will first need to connect your account. The account connecting process is standard for Google Spreadsheets, you can see more info about connecting an account here. Once the account is added / chosen, add the SpreadsheetID and Worksheet name.
For the Spreadsheet ID, enter the last string of characters in the URL for your spreadsheet.
For example, in the URL:
https://docs.google.com/spreadsheets/d/1qpyC0XzvTcKT6EISywvqESX3A0MwQoFDE8
Bll4hps/edit#gid=0
the Spreadsheet ID is 1qpyC0XzvTcKT6EISywvqESX3A0MwQoFDE8pBll4hps
For the Worksheet name, enter your sheet name i.e. Sheet1.
Next is the Spreadsheet Data Range. The data range is different for each widget depending on its type and has to be defined as the Numerics Widget Data Specification. Below, each of the types of widgets are listed along with examples of data ranges that are compatible with the Numerics Widget Data Specification.
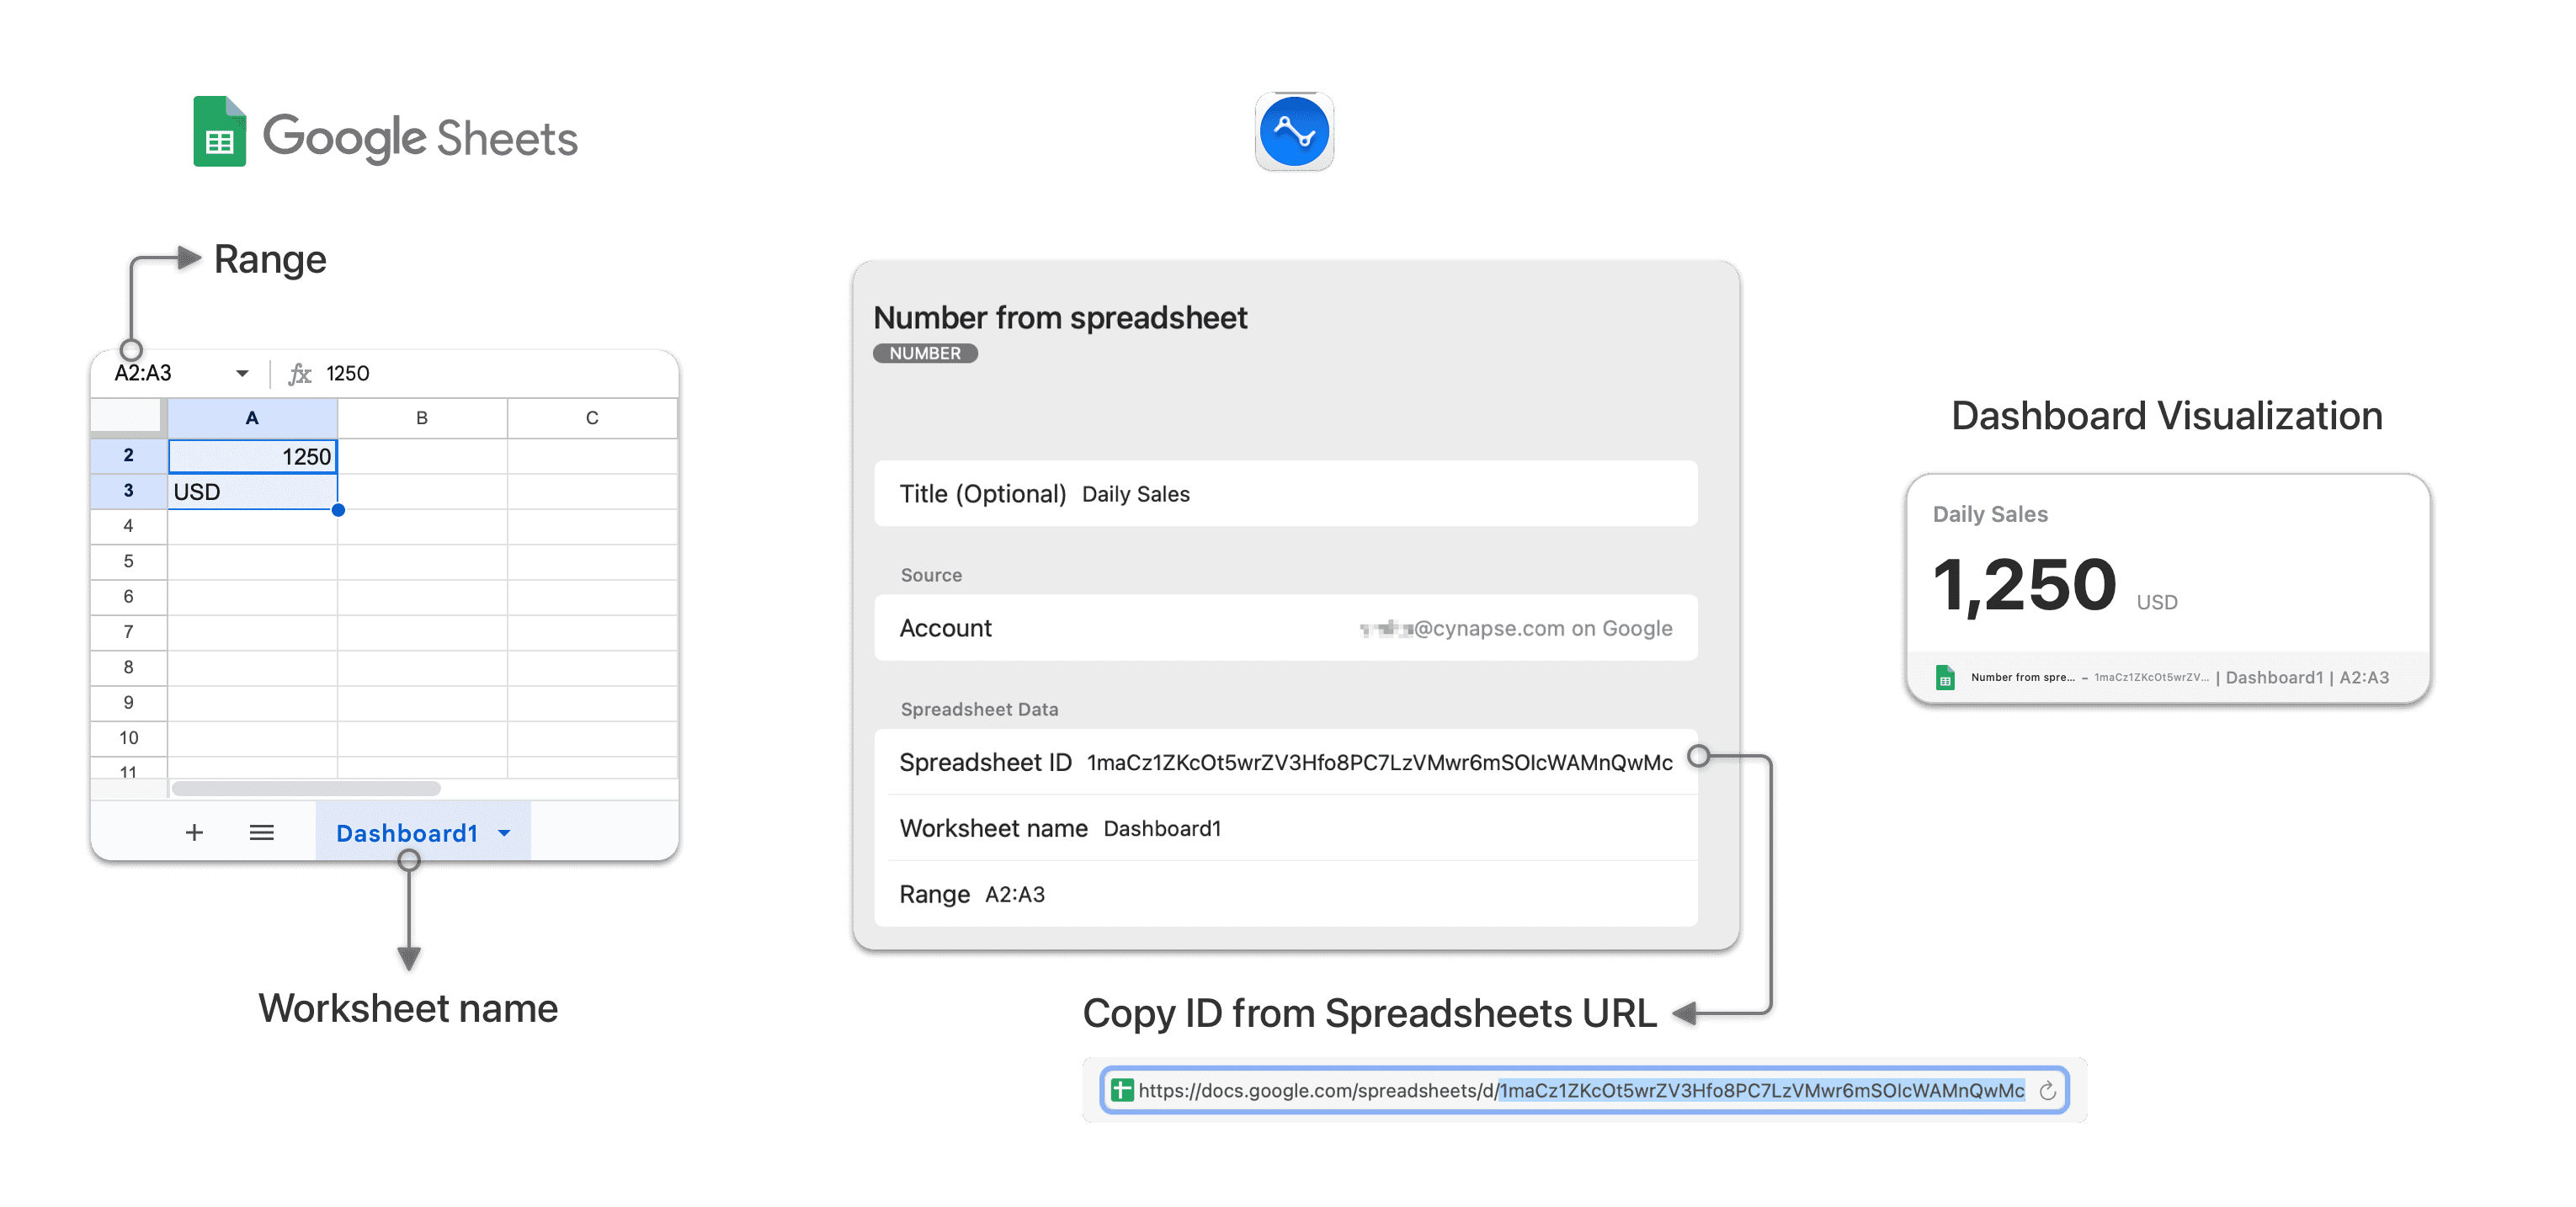
Google Spreadsheets Custom Count
For the range, specify a 1 column by 2 row range. The first row cell must contain a number value and is displayed as the main number tally. The second row cell is displayed as a postfix (units) for the main number displayed and can be any value including date or text. Providing a single row cell value will display the number without any postfix.
For example, if the first column of your spreadsheet looks like this:
| 500 |
| USD |
Adding a range of A1:A2, will display 500 USD on your dashboard.
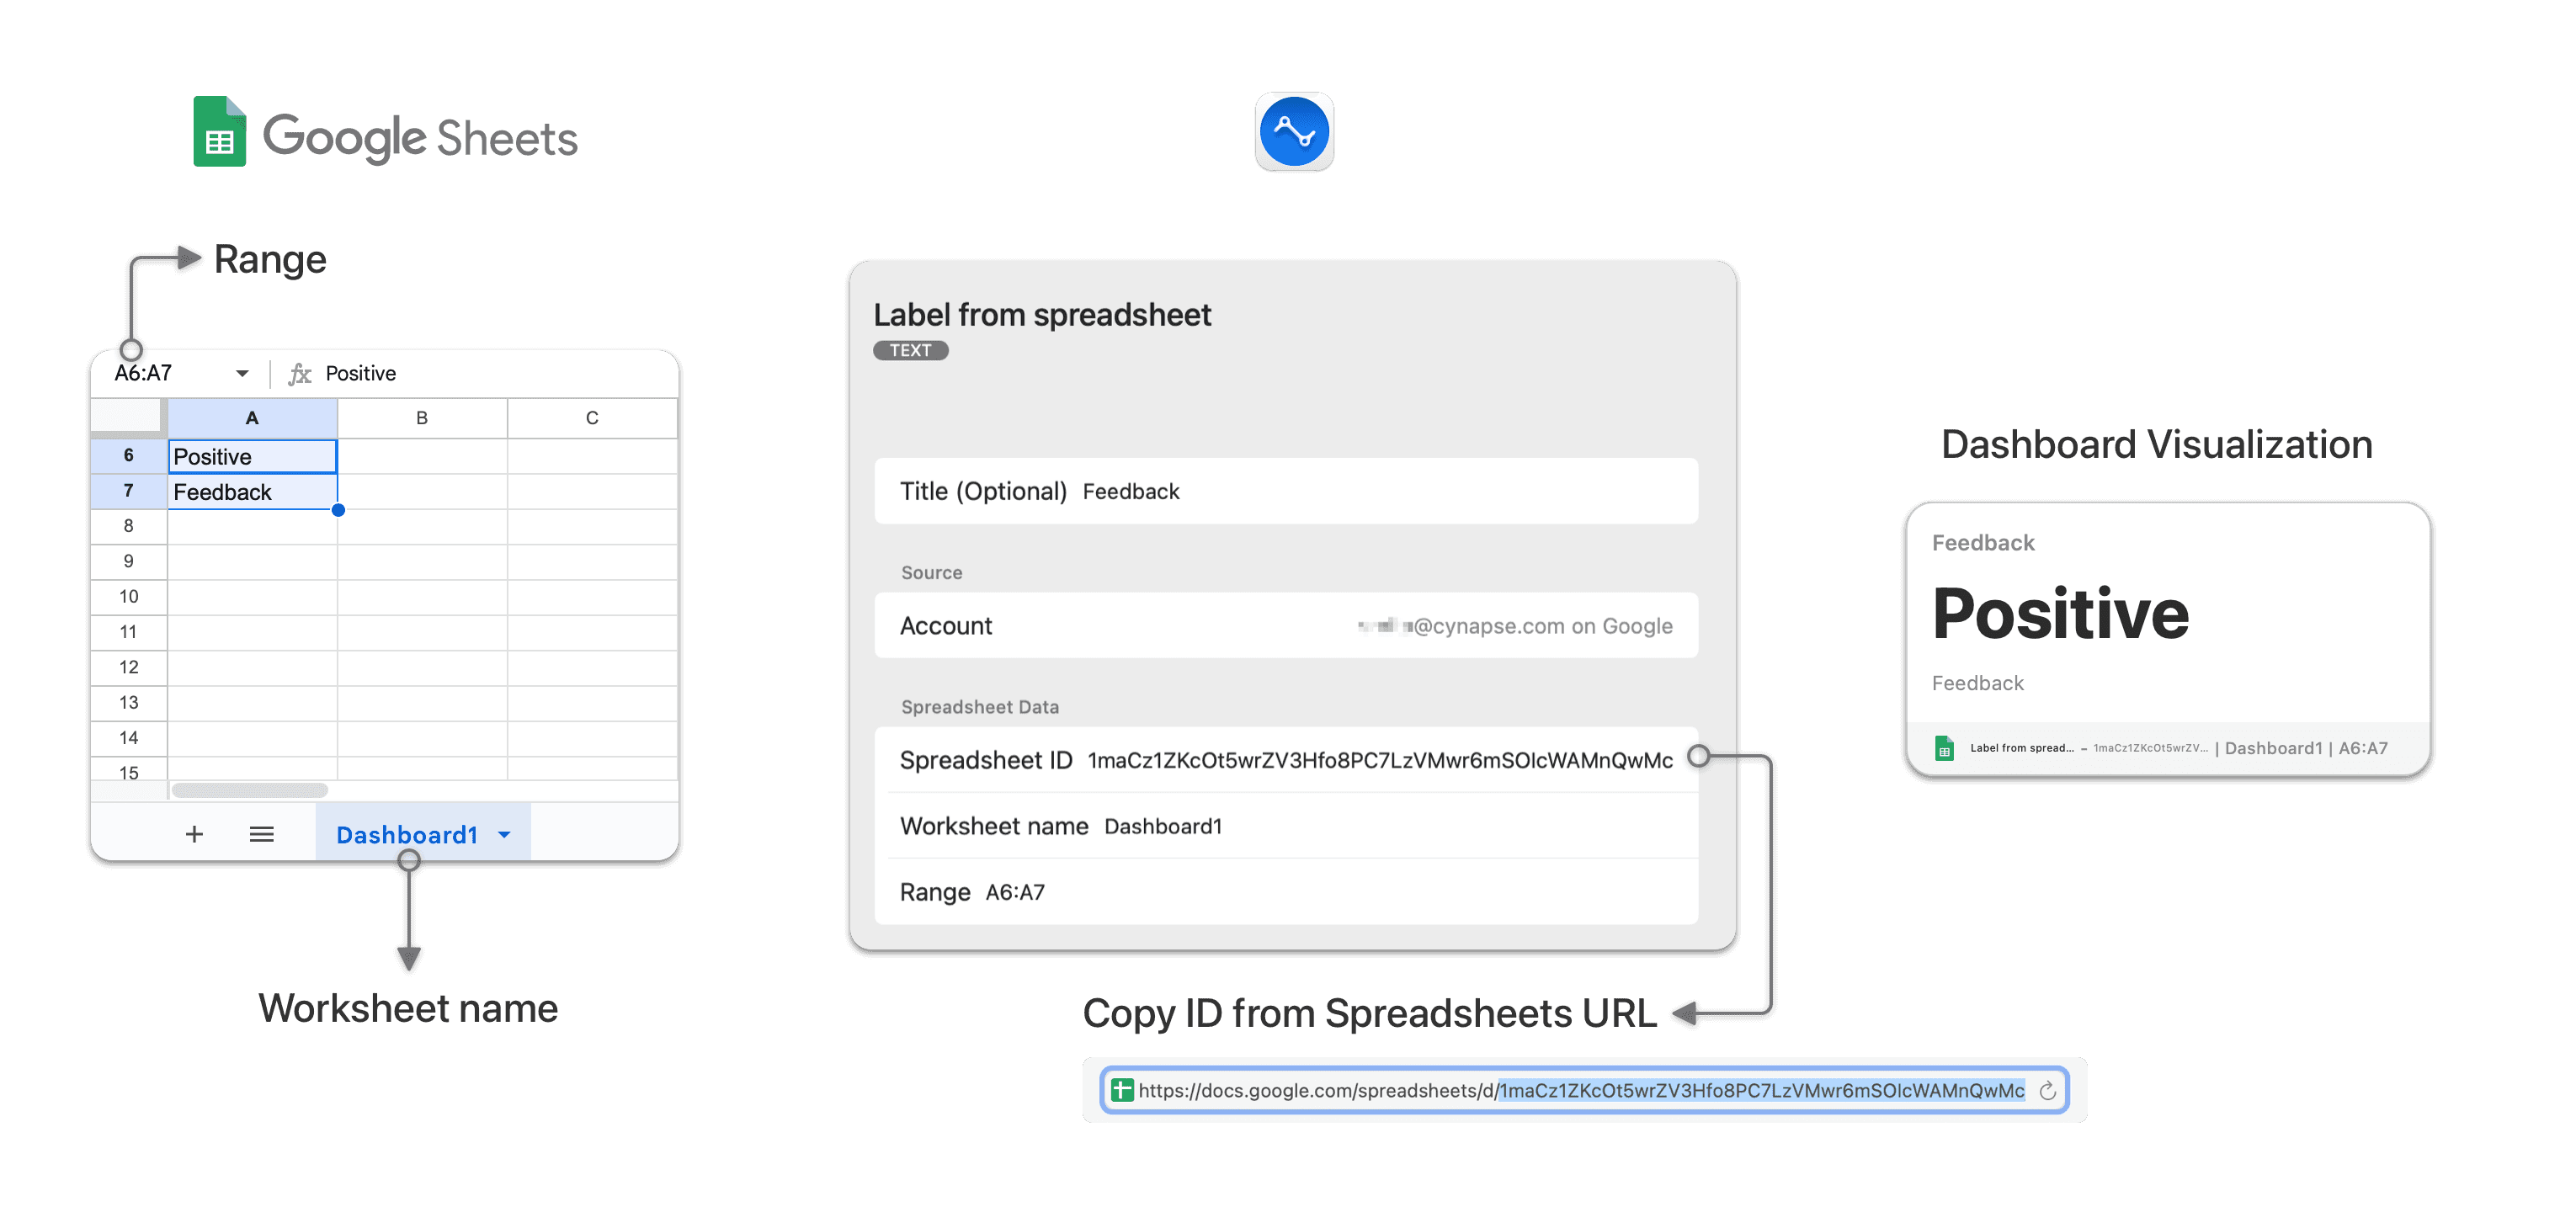
Google Spreadsheets Custom Label
For the range, specify a 1 column by 2 row range. The first row cell must contain a text value and is displayed as the main text label. The second row will be displayed as a postfix (units) below the custom text label and can be any value including date or text. Providing a single row cell value will display the custom text label without any postfix.
For example, if the first column of your spreadsheet looks like this:
| Sales Conference |
| 5th October |
Adding a range A1:A2, will display Sales Conference, 5th October on your dashboard.
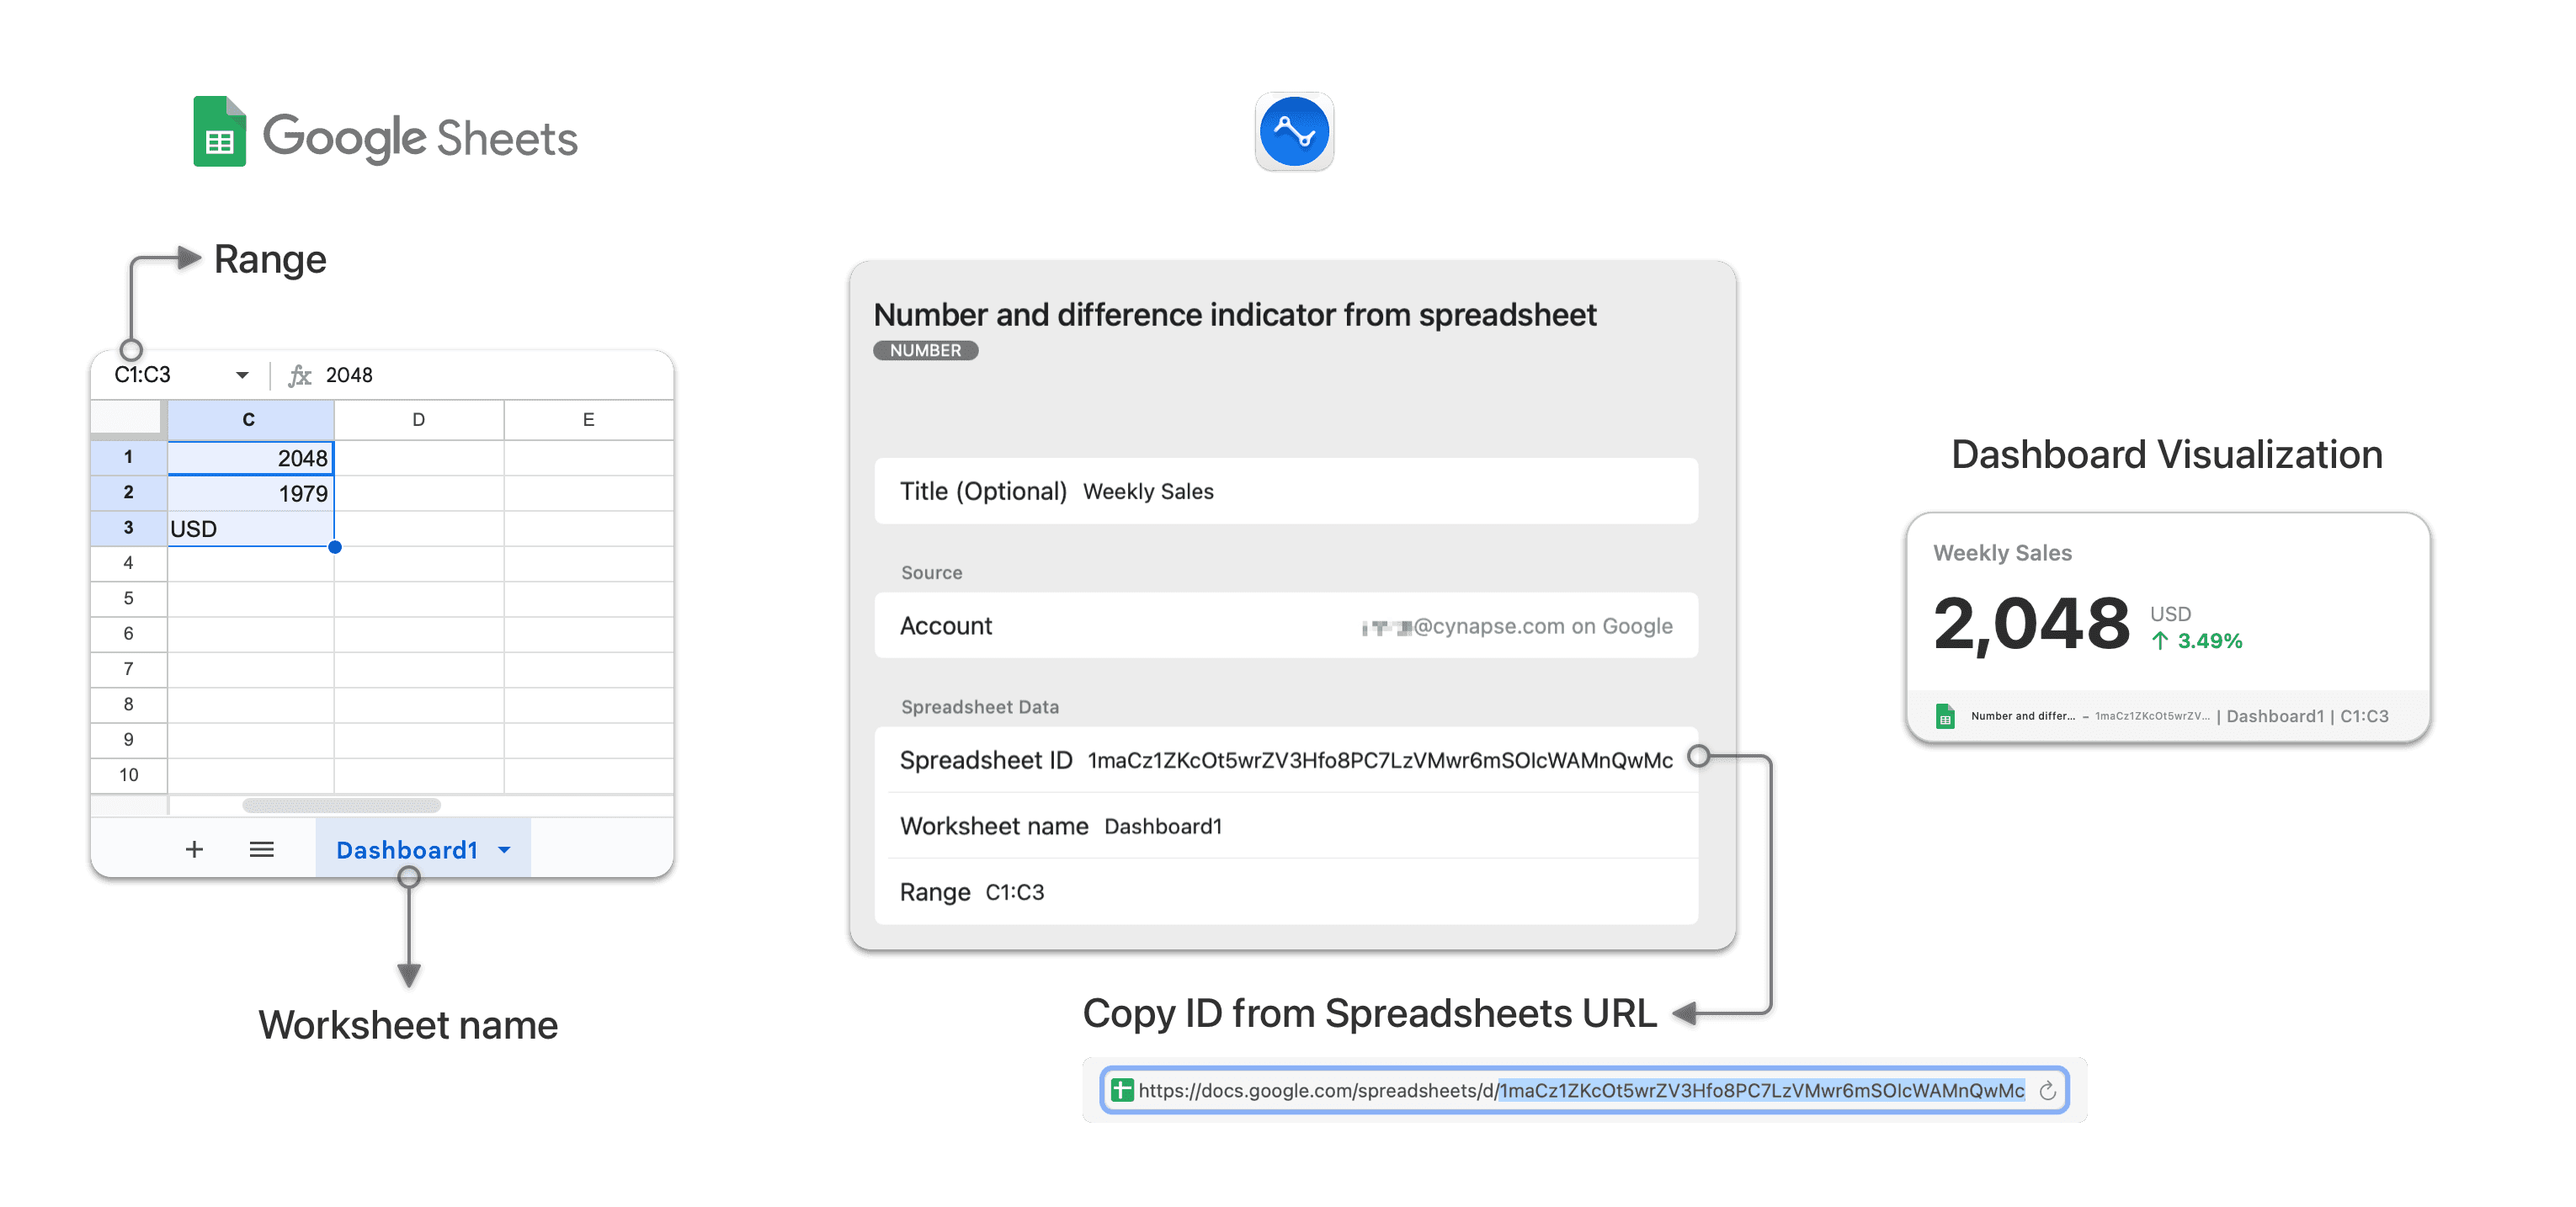
Google Spreadsheets Custom Count and Change
For the range, specify a 1 column by 3 row range. The first row and the second row cells must contain number values. The first cell value is displayed as the main number tally. Below this, the widget will automatically calculate and display the percentage difference from the values of the two cells. The value of the third row cell is displayed as a postfix (units) for the number tally and can be any value including date or text. The first and second row cell values are required, the third row cell displayed is optional.
For example, if the first column of your spreadsheet looks like this:
| 100 |
| 75 |
| USD |
Adding a range A1:A3, will display the value 100 USD with a percentage change of +33%.
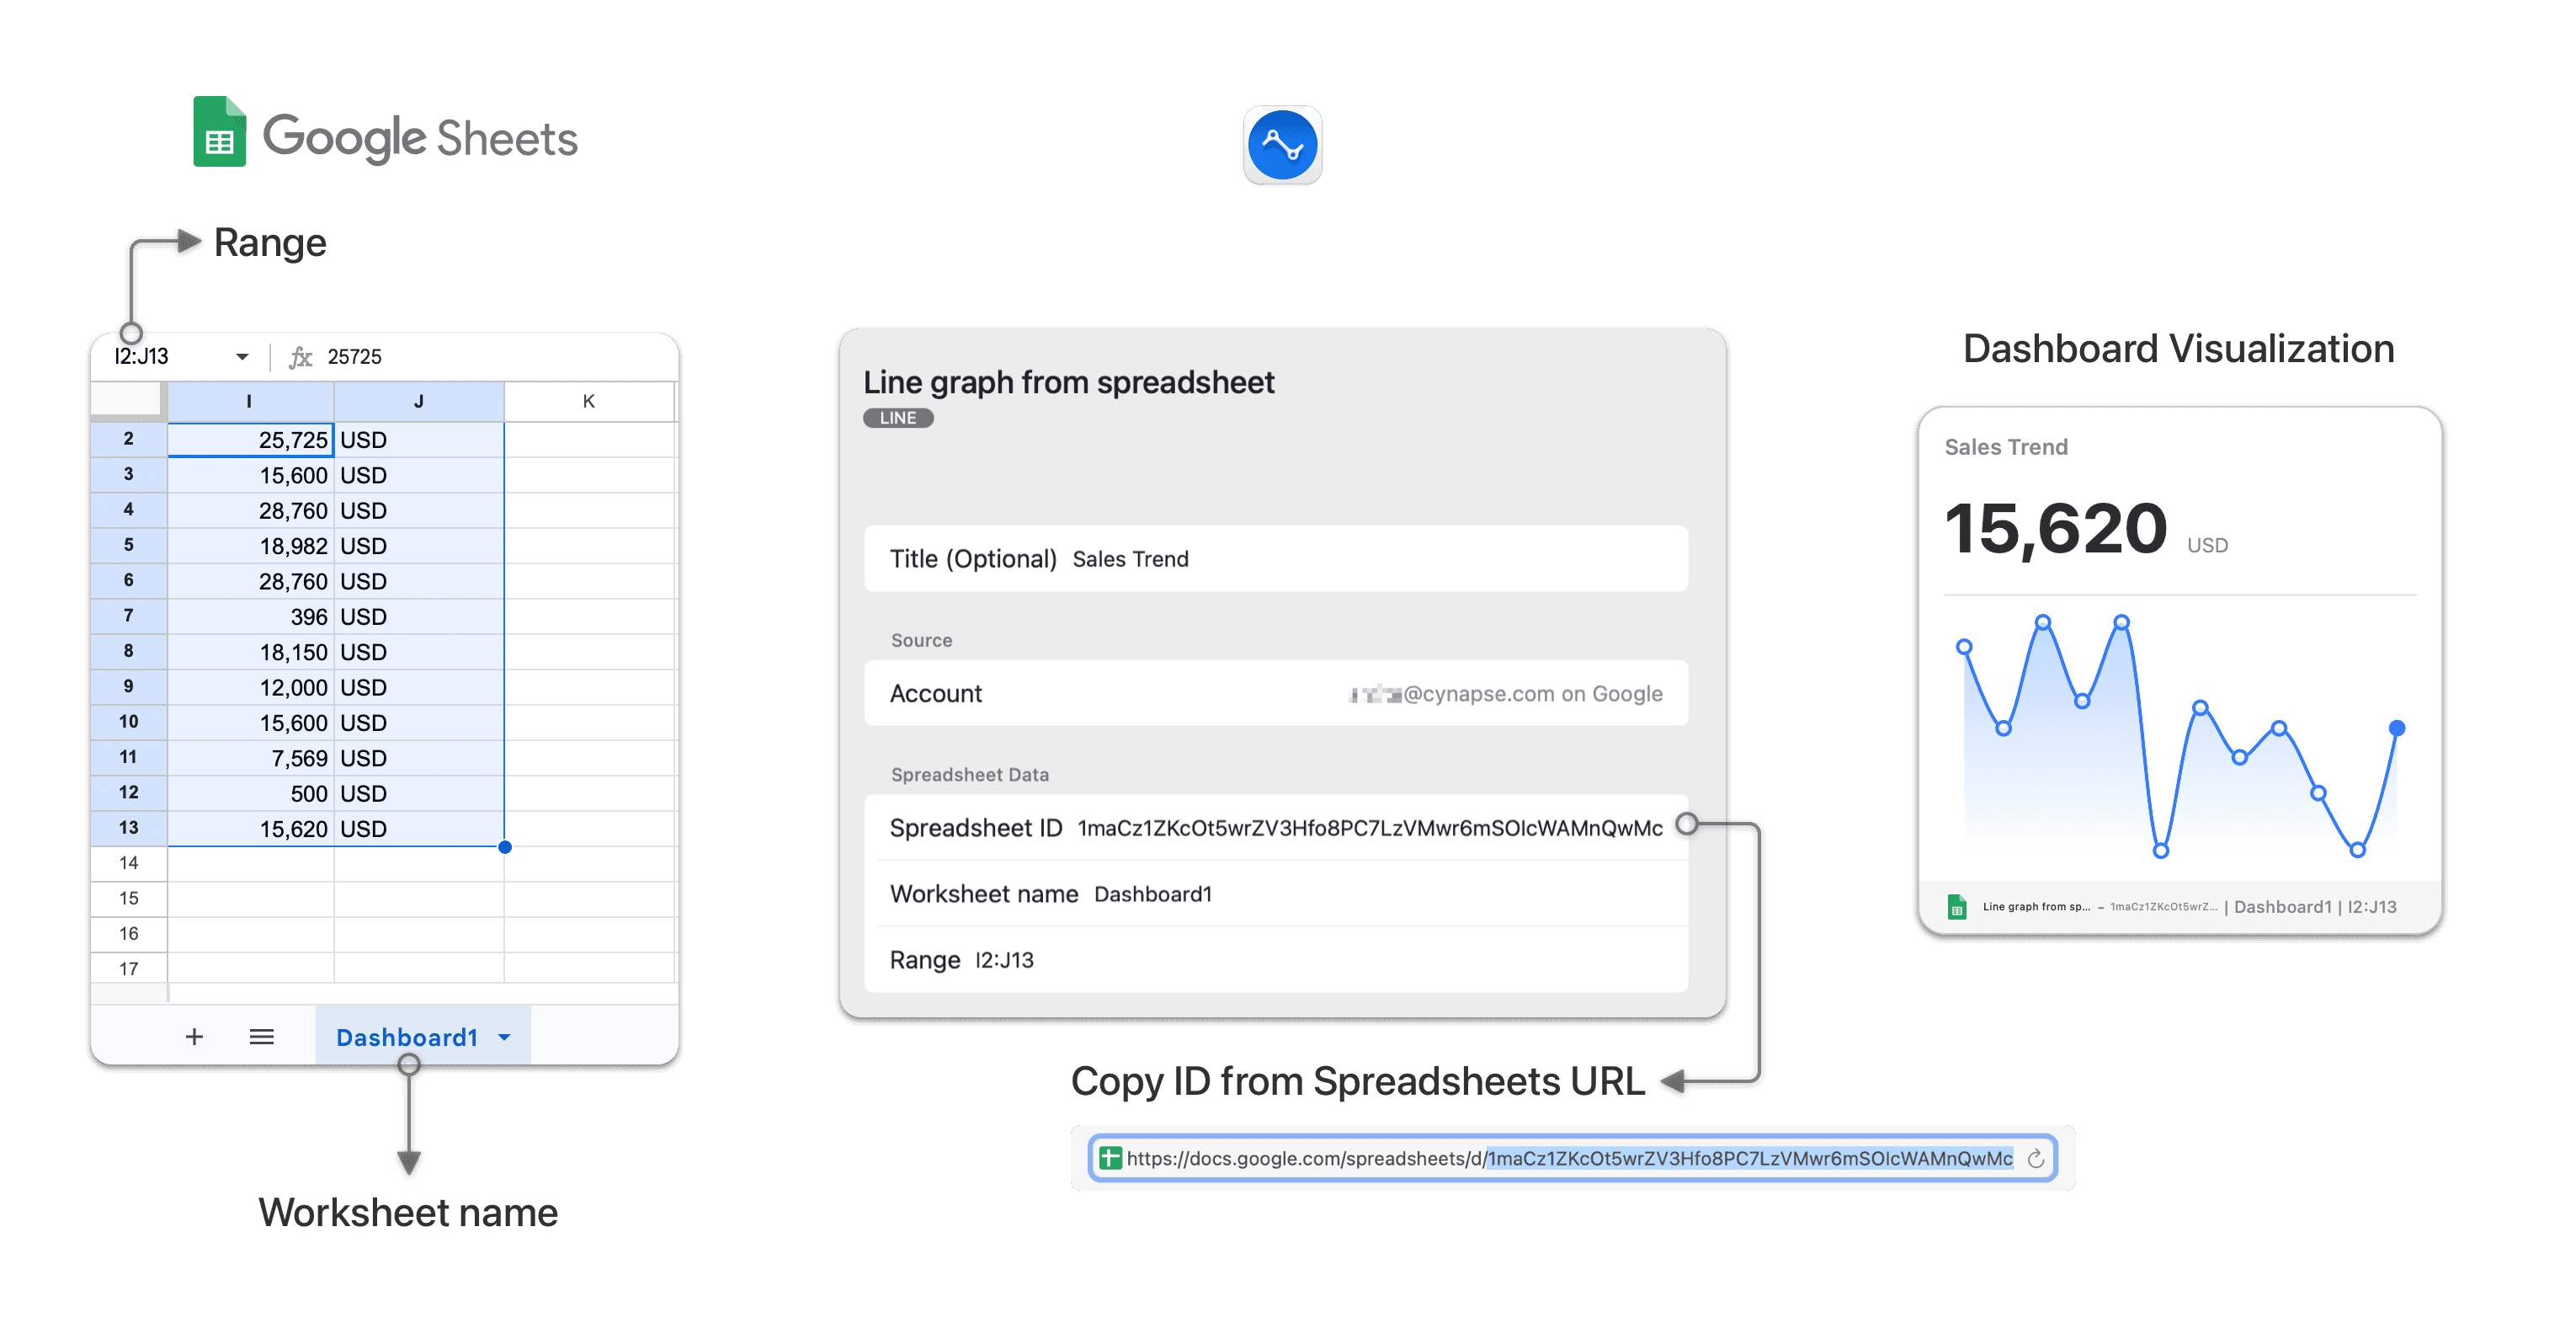
Google Spreadsheets Custom Line Graph
For the range, specify a 2 column by 'n' rows range (Max 31). The first column must contain number values that are used as y-axis values to plot your custom line graph. The first value from the second column forms the postfix or units for all the values presented on the line graph and can be any value including date or text. The first column values are required, the second column is optional.
For example, if your spreadsheet looks like this:
| 100 | USD |
| 200 |
| 300 |
| 400 |
| 500 |
To plot your these values on a line graph, add a range A1:B5.
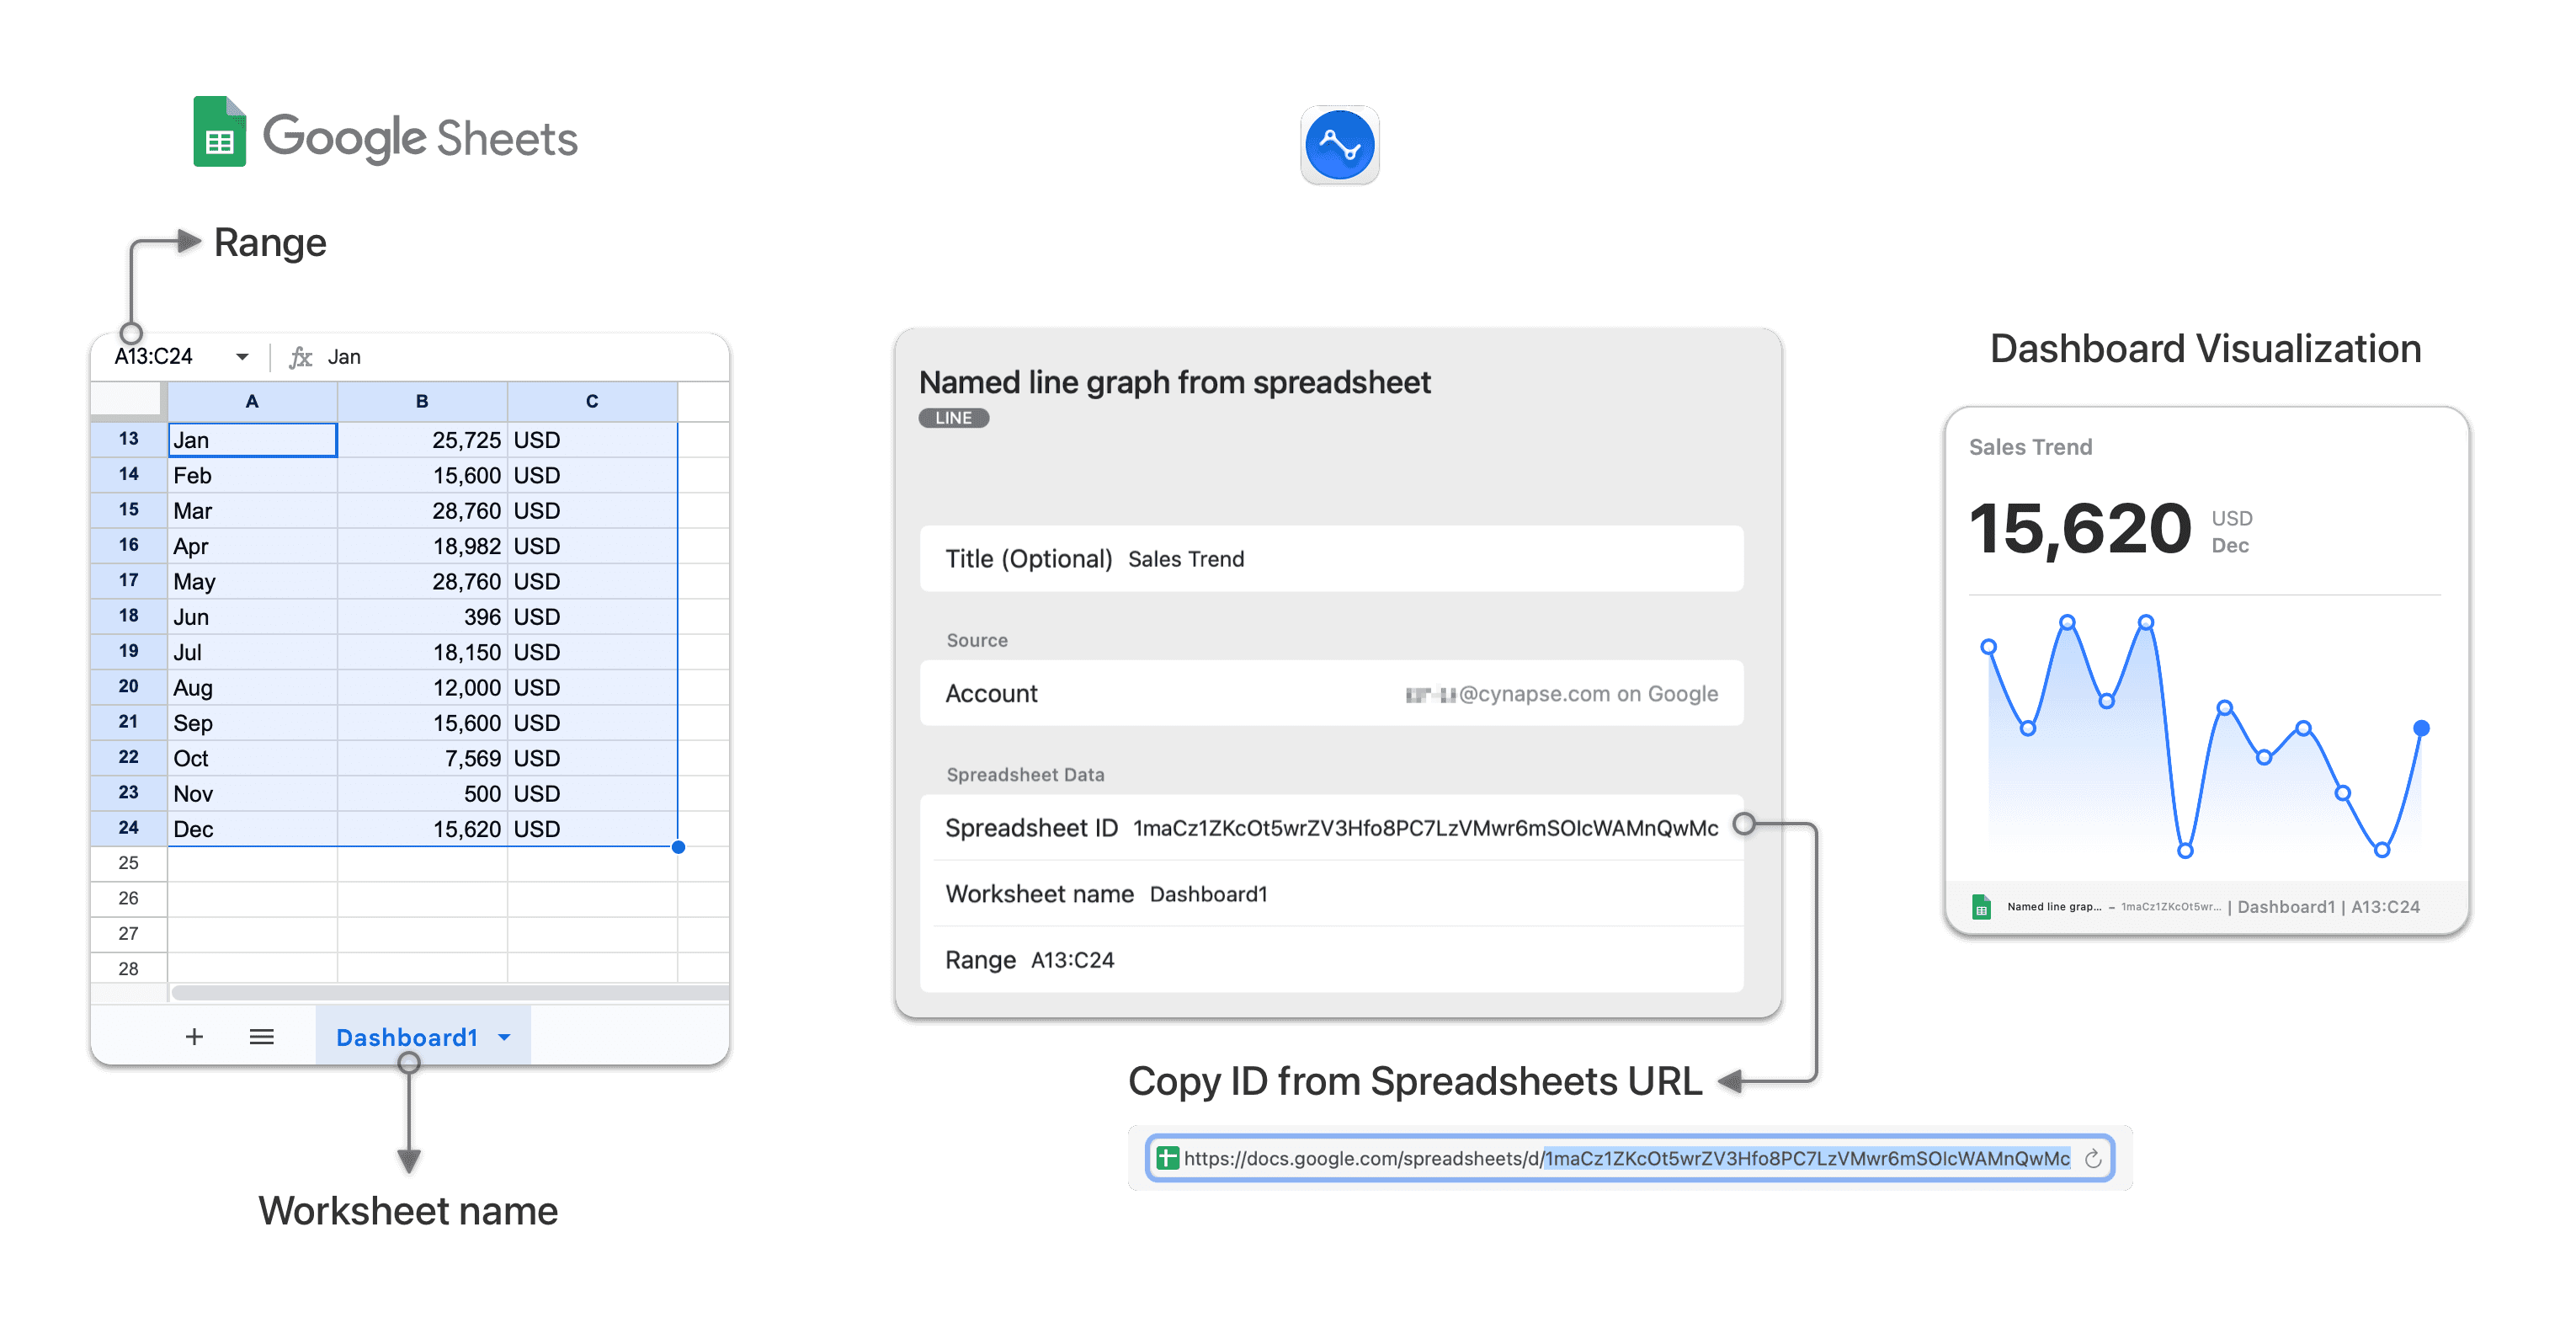
Google Spreadsheets Custom Named Line Graph
For the range, specify a 3 column x 'n' rows range (Max 31). The values of the first column will form the names of the items plotted on the x-axis. The second column must contain number values that are used as y-axis values against each item of the x-axis to plot your custom line graph. The first value from the third column forms the postfix or units for all the values presented on the line graph and can be any value including date or text. The first and second column values are required, the third column is optional.
For example, if your spreadsheet looks like this:
| Dec | 100 | USD |
|Feb | 200 |
| Mar | 500 |
| Apr | 400 |
Adding a range for A1:C4, will plot your monthly sales on a line graph with the currency as the units.
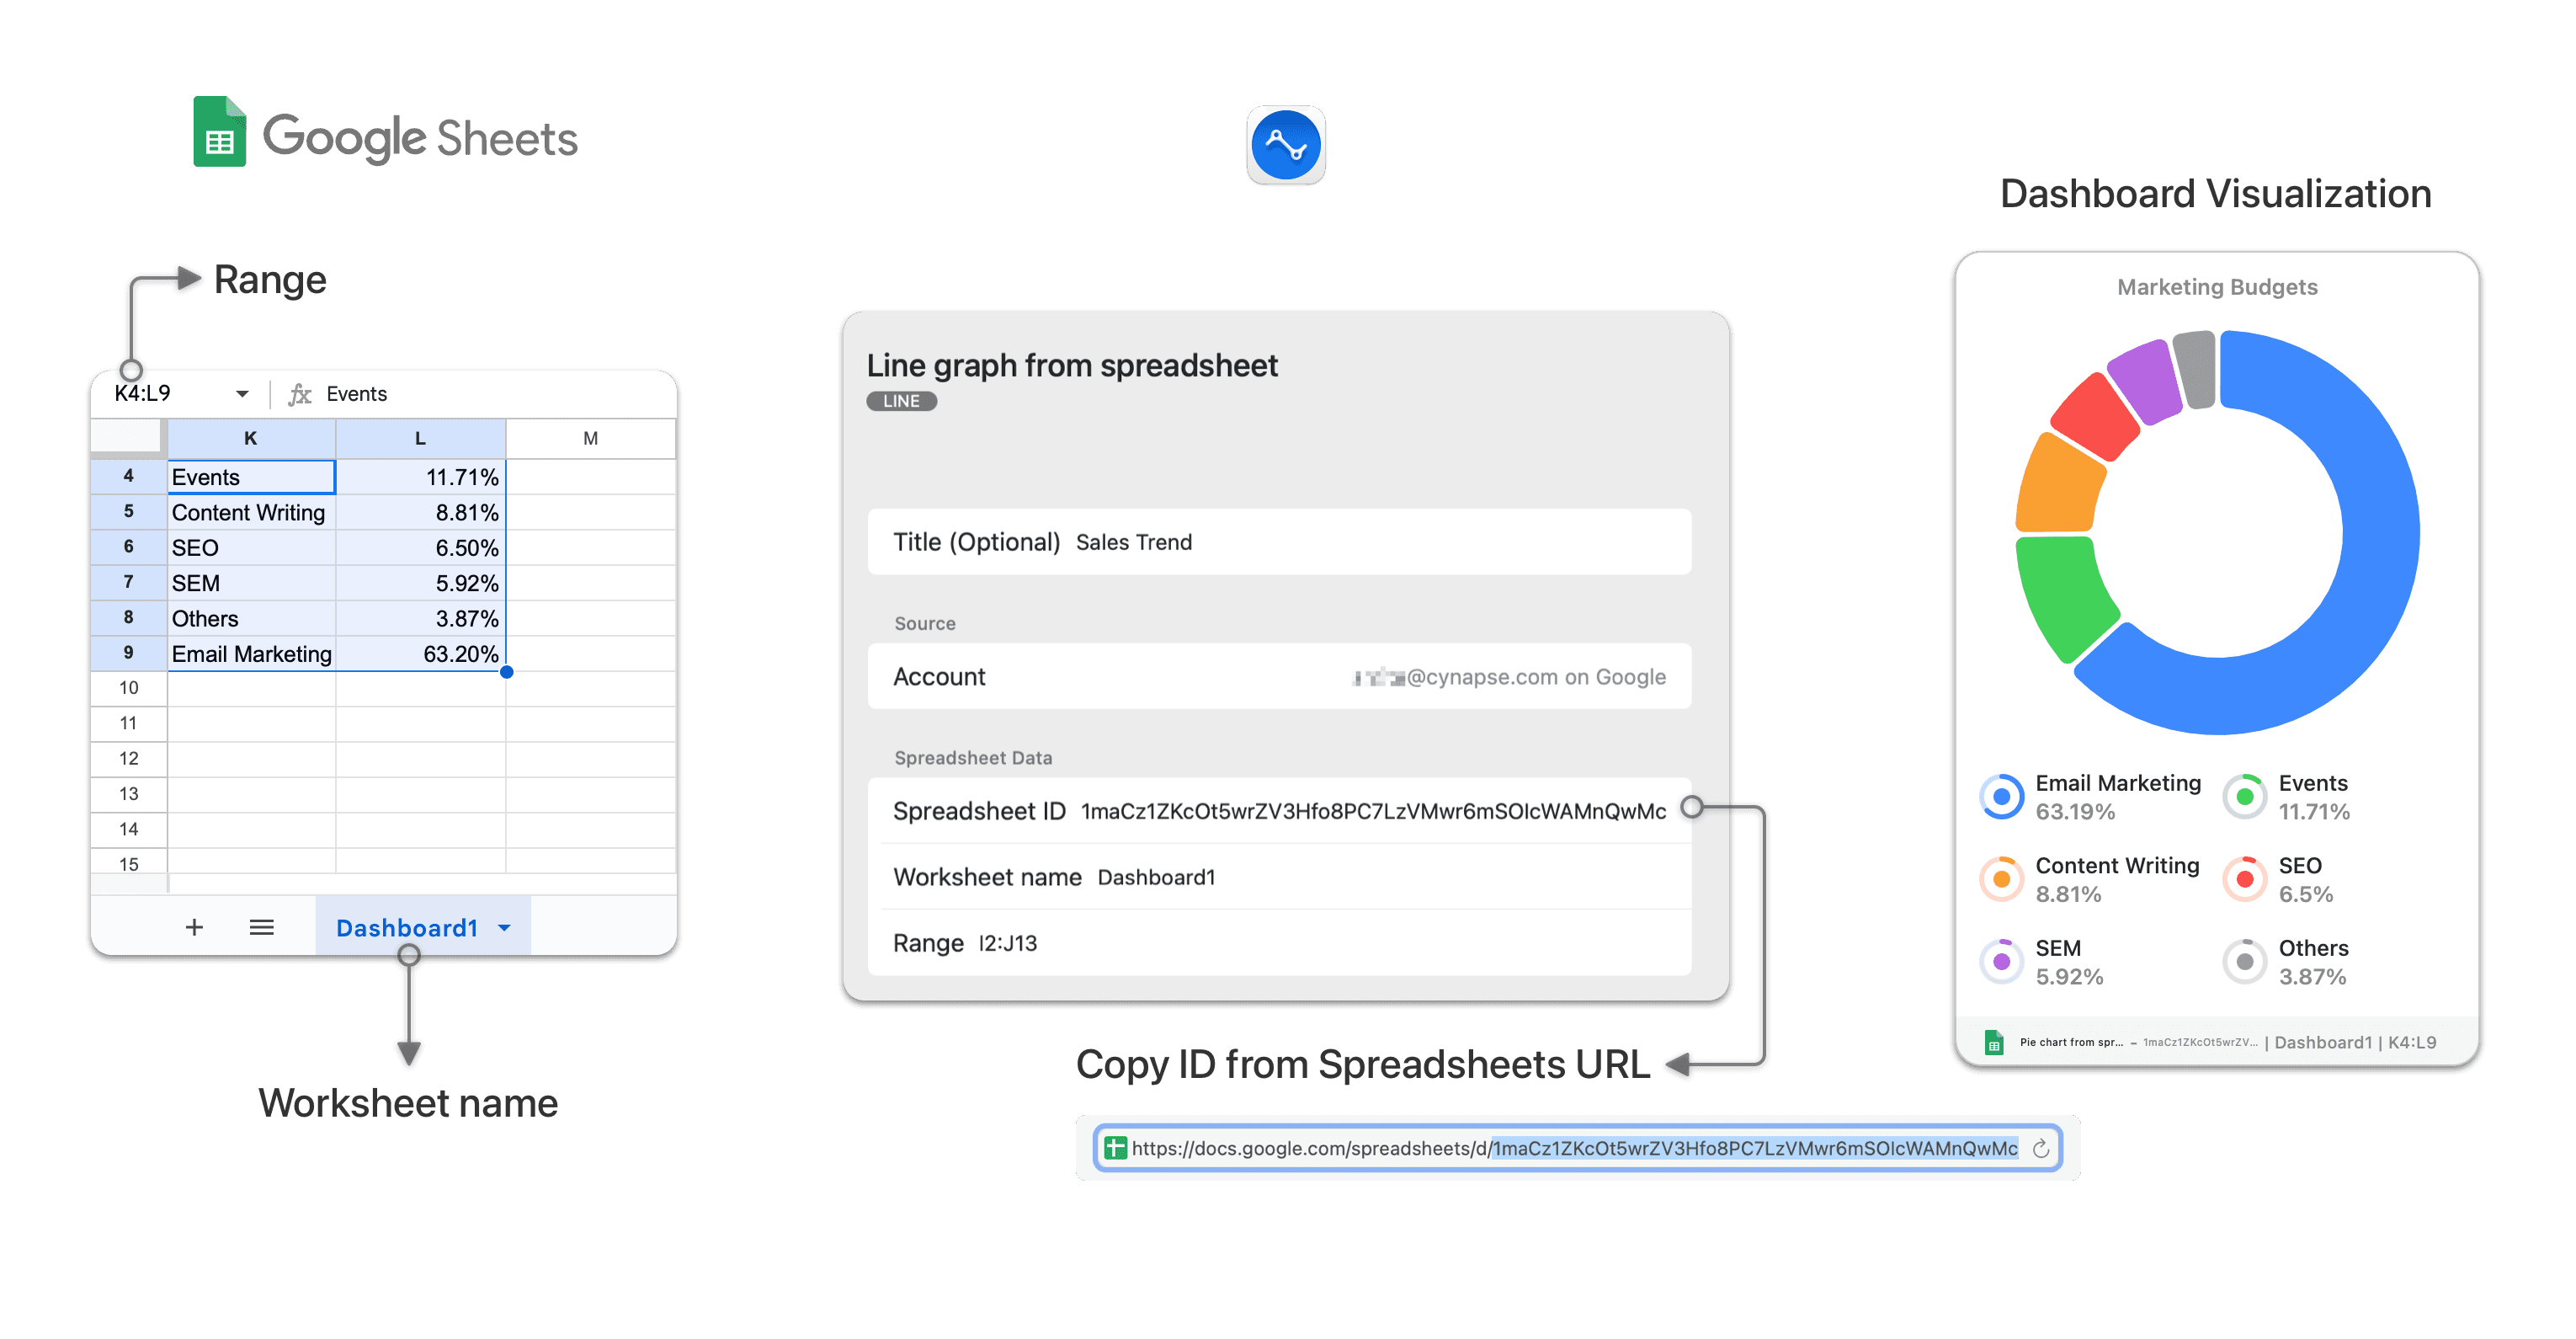
Google Spreadsheets Custom Pie Chart
For the range, specify a 2 column by 'n' rows range. The first column must have the names for which the values are provided and can be any format including text, while the second column must have number values that are used to form the slices of the pie. The pie chart automatically calculates the percentage value of each part of the pie, takes the top 5 values to draw 5 slices of the pie. If there are more than 5 values the remaining values are added up to create the 6th slice named 'Other'.
For example, if your spreadsheet looks like this:
| Jake | 110 |
| Jude | 100 |
| Alan | 150 |
| Rick | 200 |
| Alex | 650 |
| Jane | 200 |
| Pete | 220 |
Adding a range of A1:B7, will display a pie of the total values broken down by the names of the people. The slices for 'Jude' and 'Alan' would be added up into one slice called other.
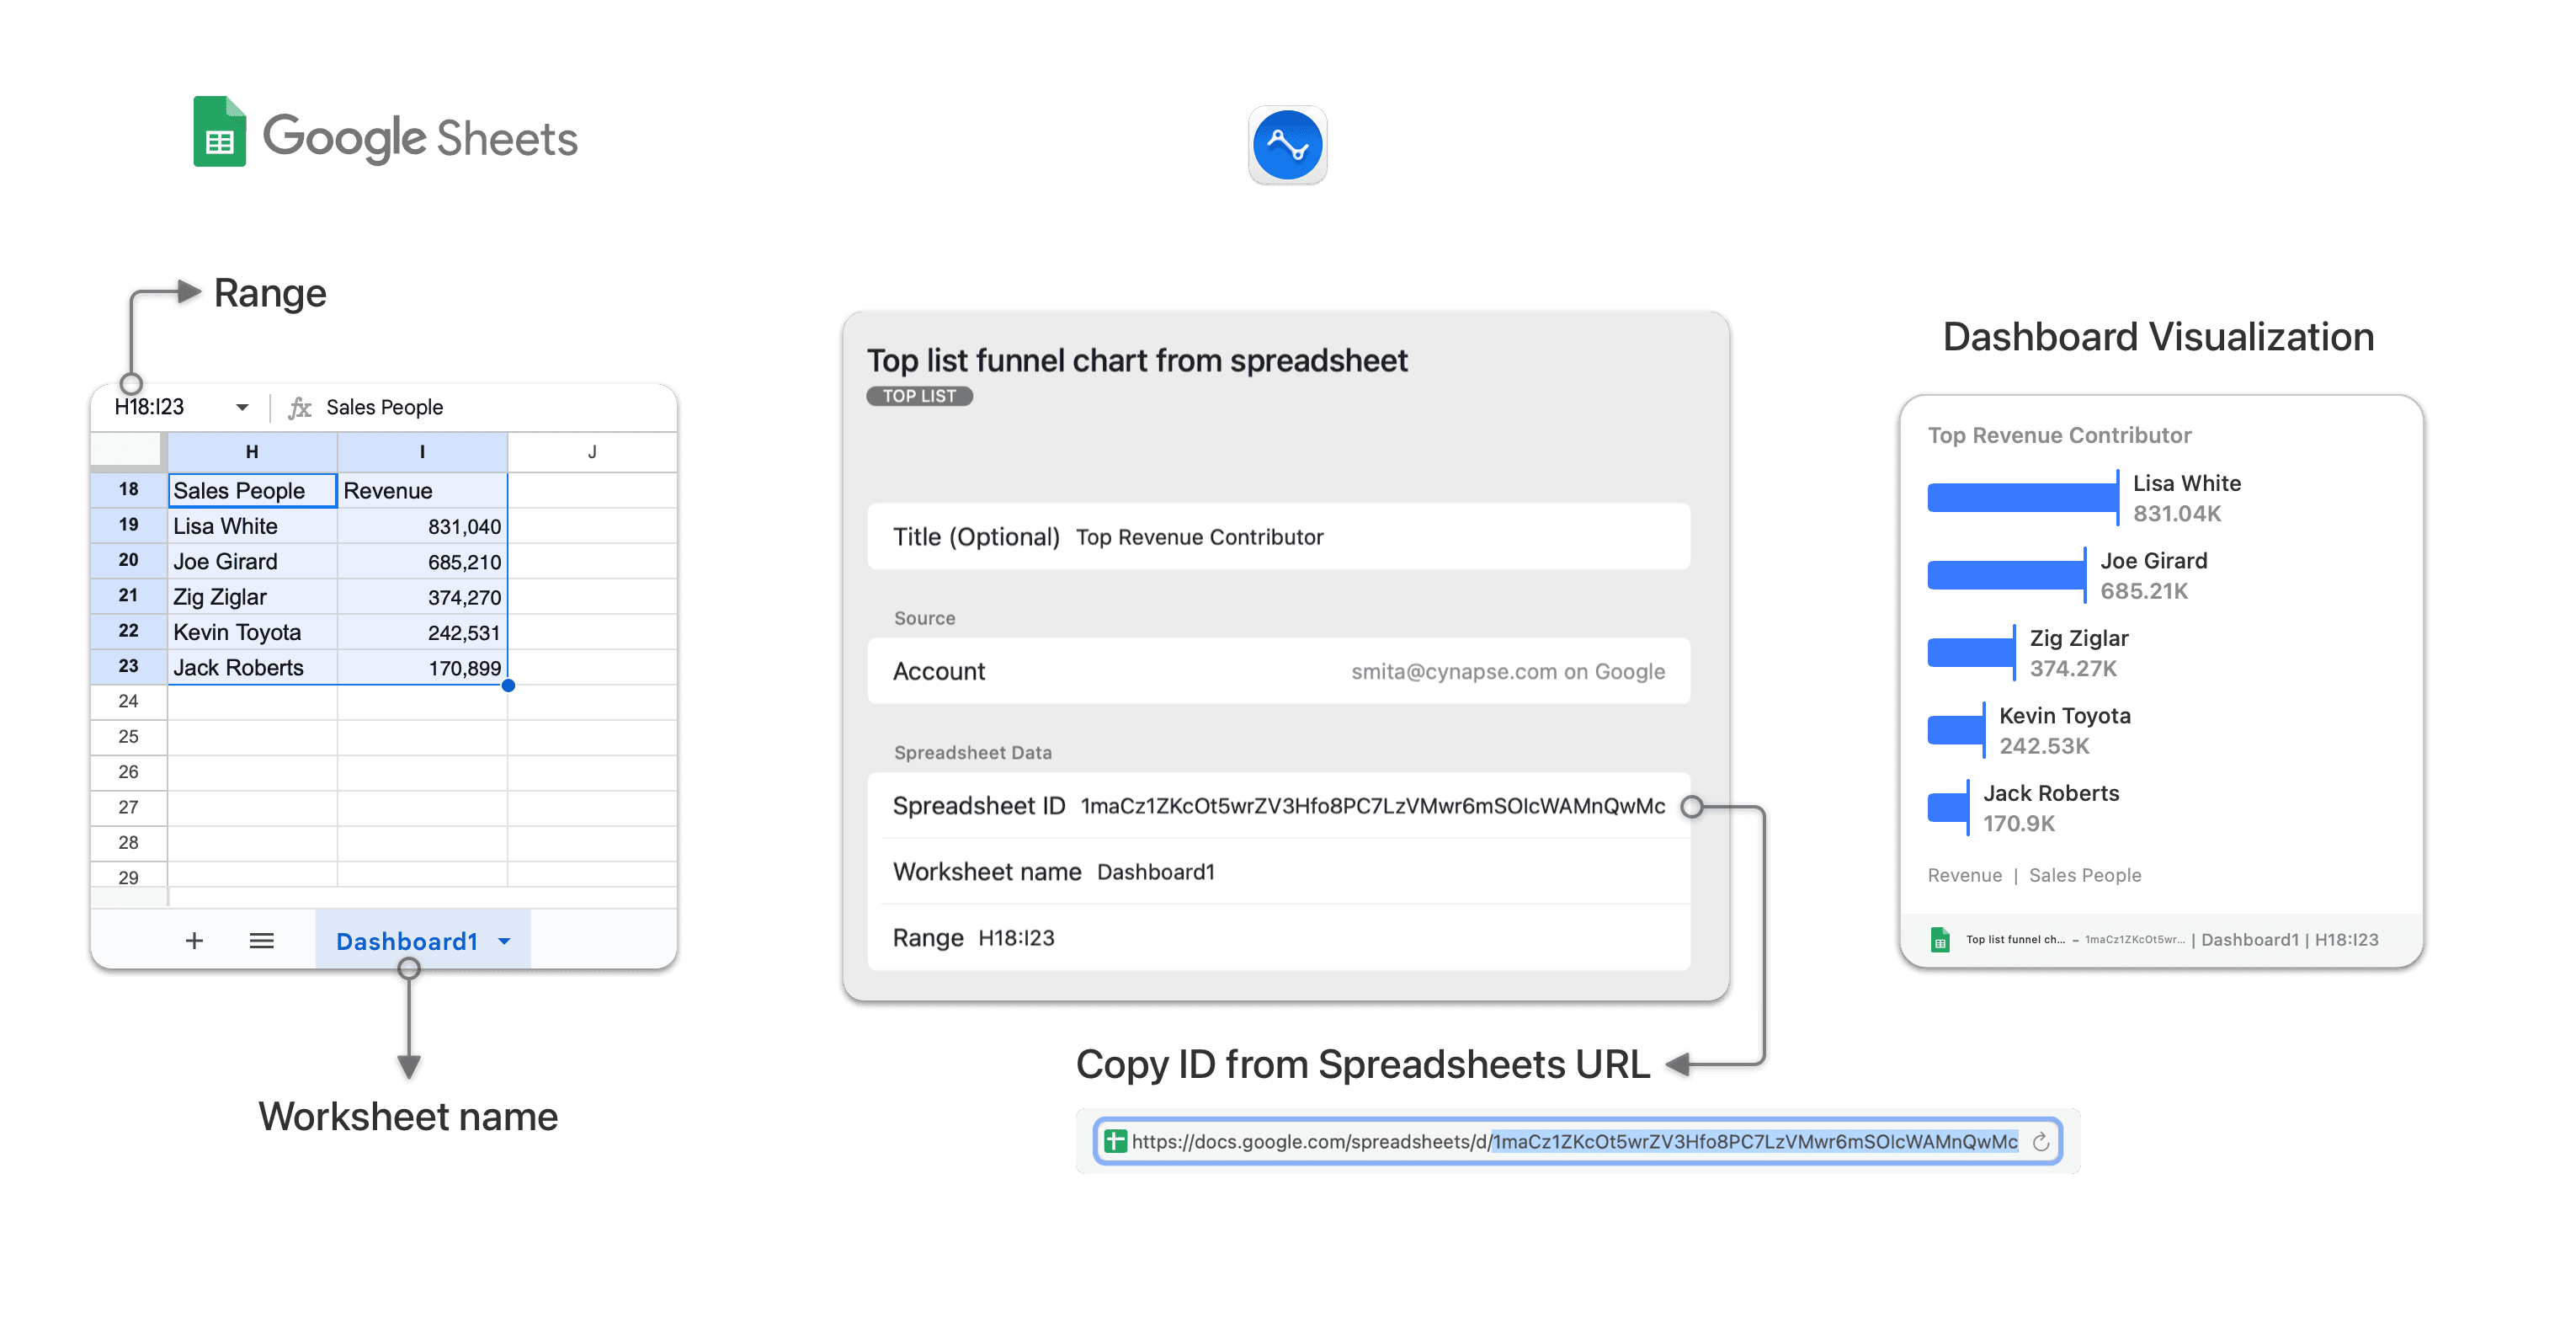
Google Spreadsheets Custom Toplist Funnel Chart
For the range, specify a 2 column by 'n' rows range. The first column must have the names for which the values are provided and can be any format including text, while the second column must have number values that are used to form the funnel chart. Additionally, the first row of both the columns must have the heading titles for the two sides of the top list. The Top List Funnel chart will automatically sort and pick up the top 5 items from your custom data and draw a funnel chart.
For example, if your spreadsheet looks like this:
| Countries | Sales |
| USA | 450 |
| UK | 100 |
| China | 150 |
| India | 200 |
| Russia |100 |
| Brazil | 910 |
Adding a range of A1:B7, will display an ordered list of the top 5 countries by sales. The value of 'Russia' will be ignored.
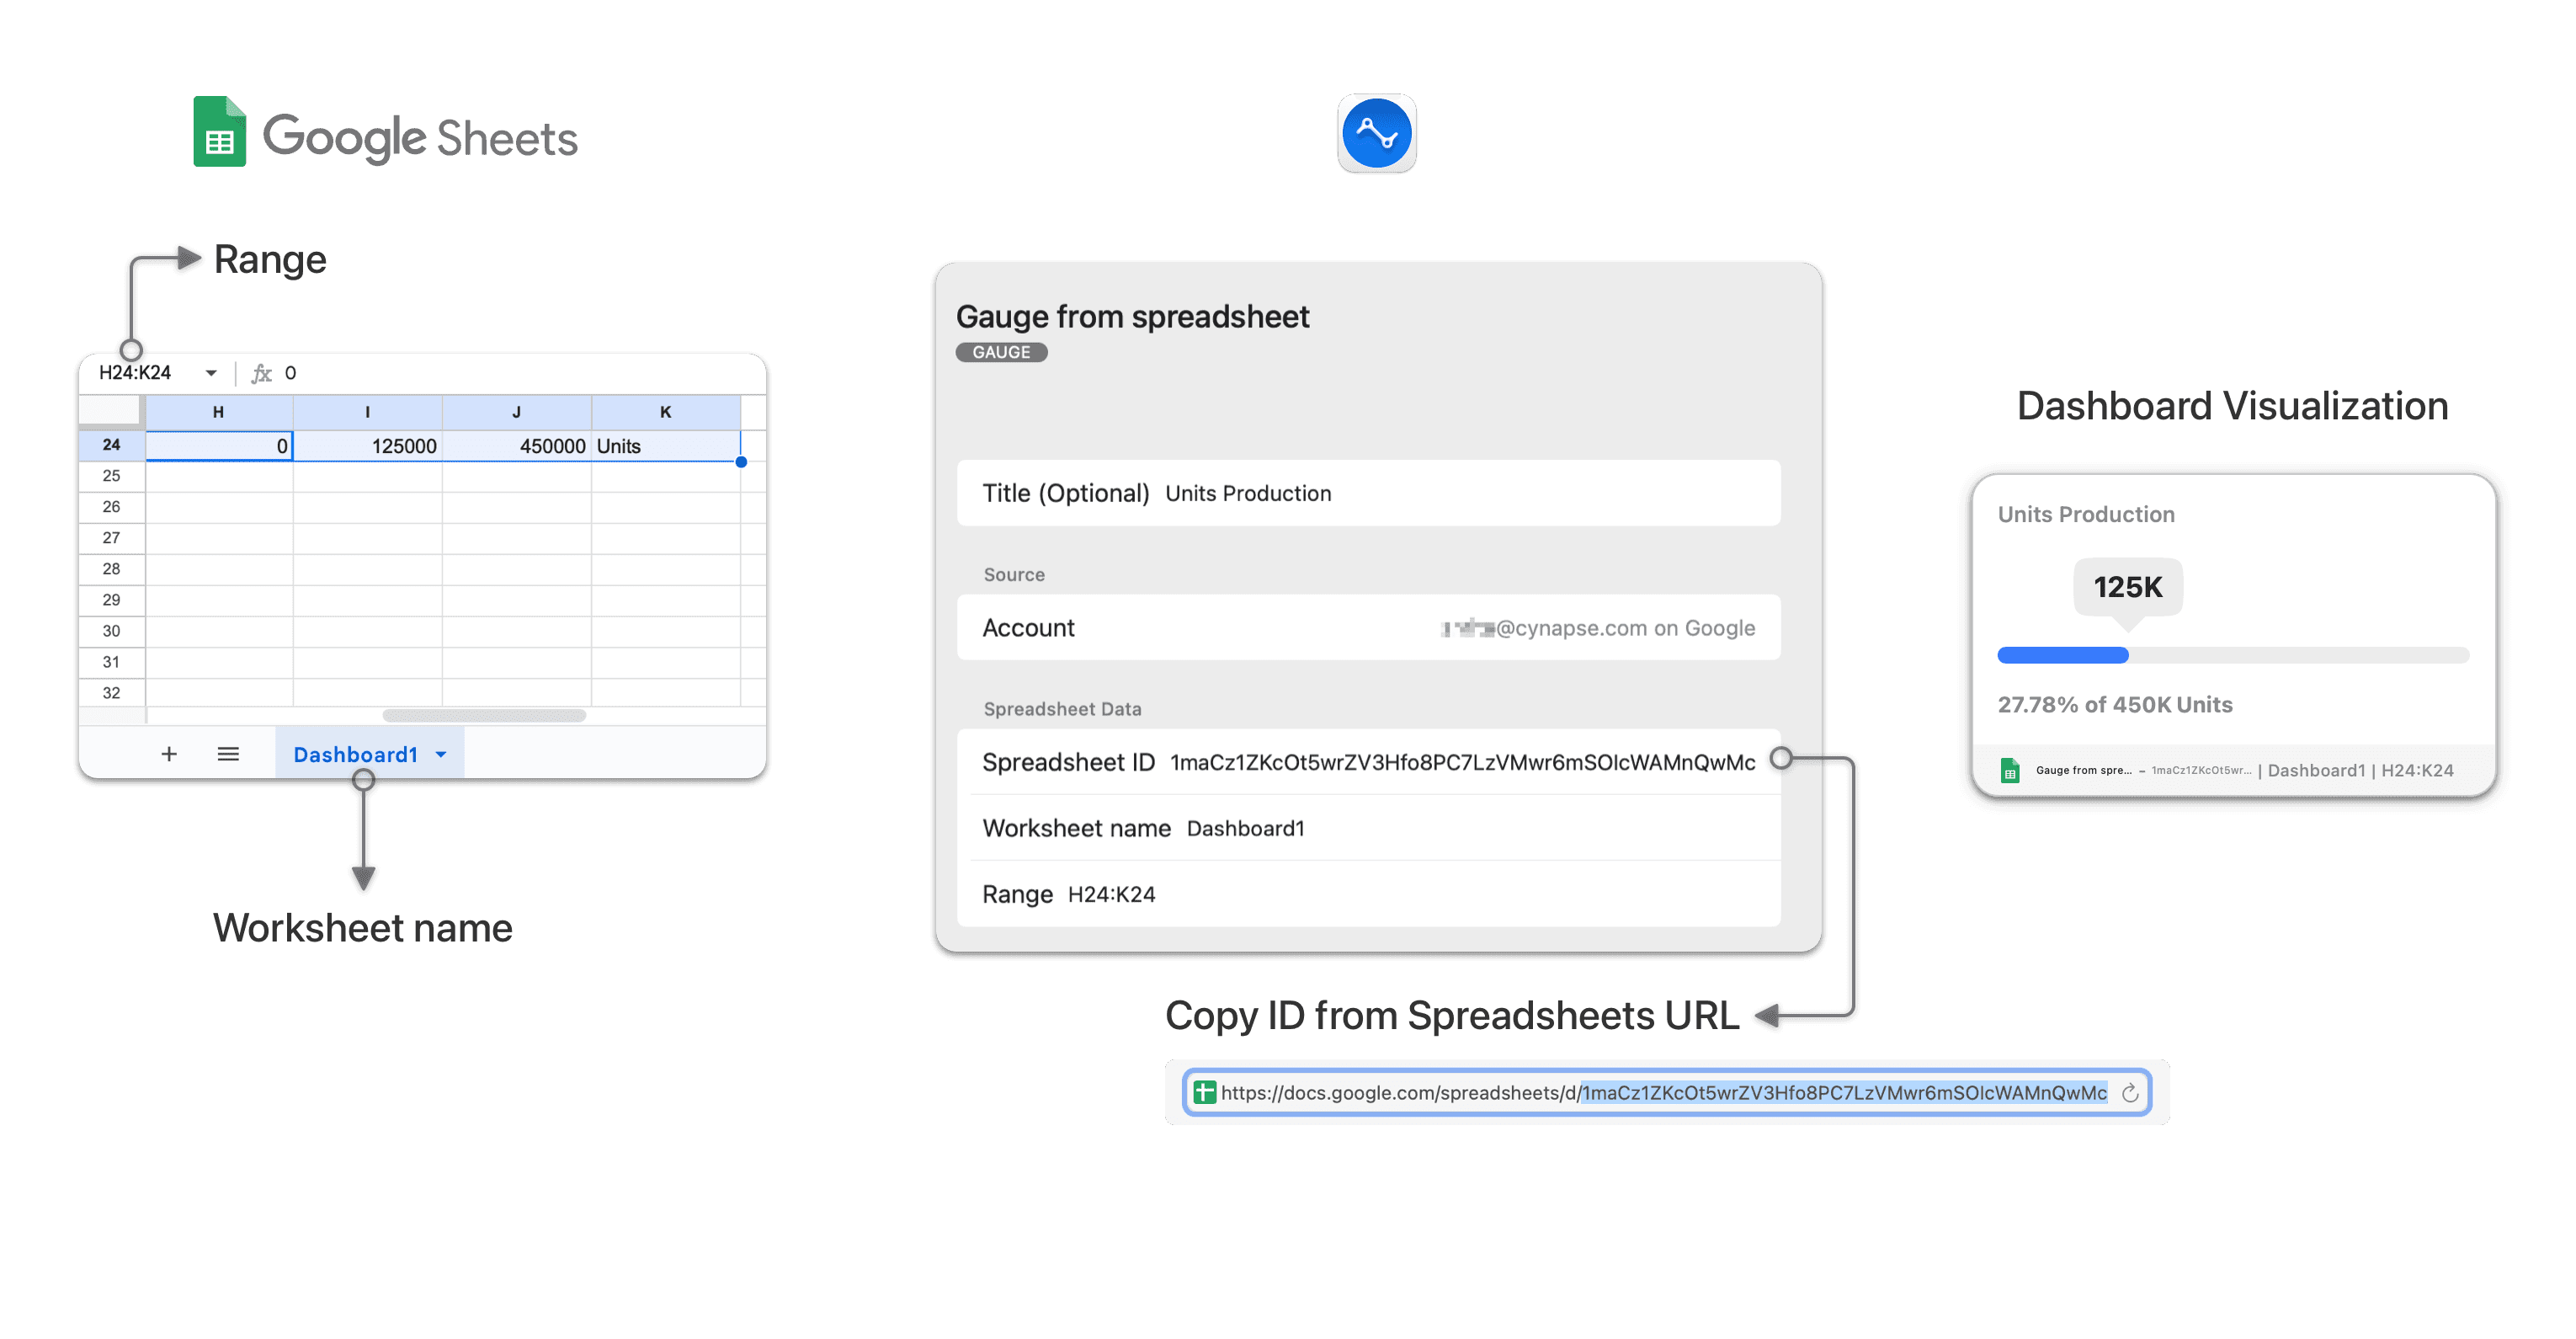
Google Spreadsheets Gauge
For the range, specify a 4 column by 1 row range. The first column cell must contain a numeric value that will be displayed as the minimum value on the gauge visualization. The second column cell must have the current value followed by the maximum value in third column cell. The fourth column will be displayed as a postfix (units) below the gauge and can be any value including date or text.
For example, if the 4 columns of your spreadsheet look like this:
| 0 | 55 | 100 | Sales |
Adding a range A1:D1, will display a gauge with 0 & 100 as the minimum and maximum values on the gauge and 55 as the current progress value. Sales will be displayed as a postfix.
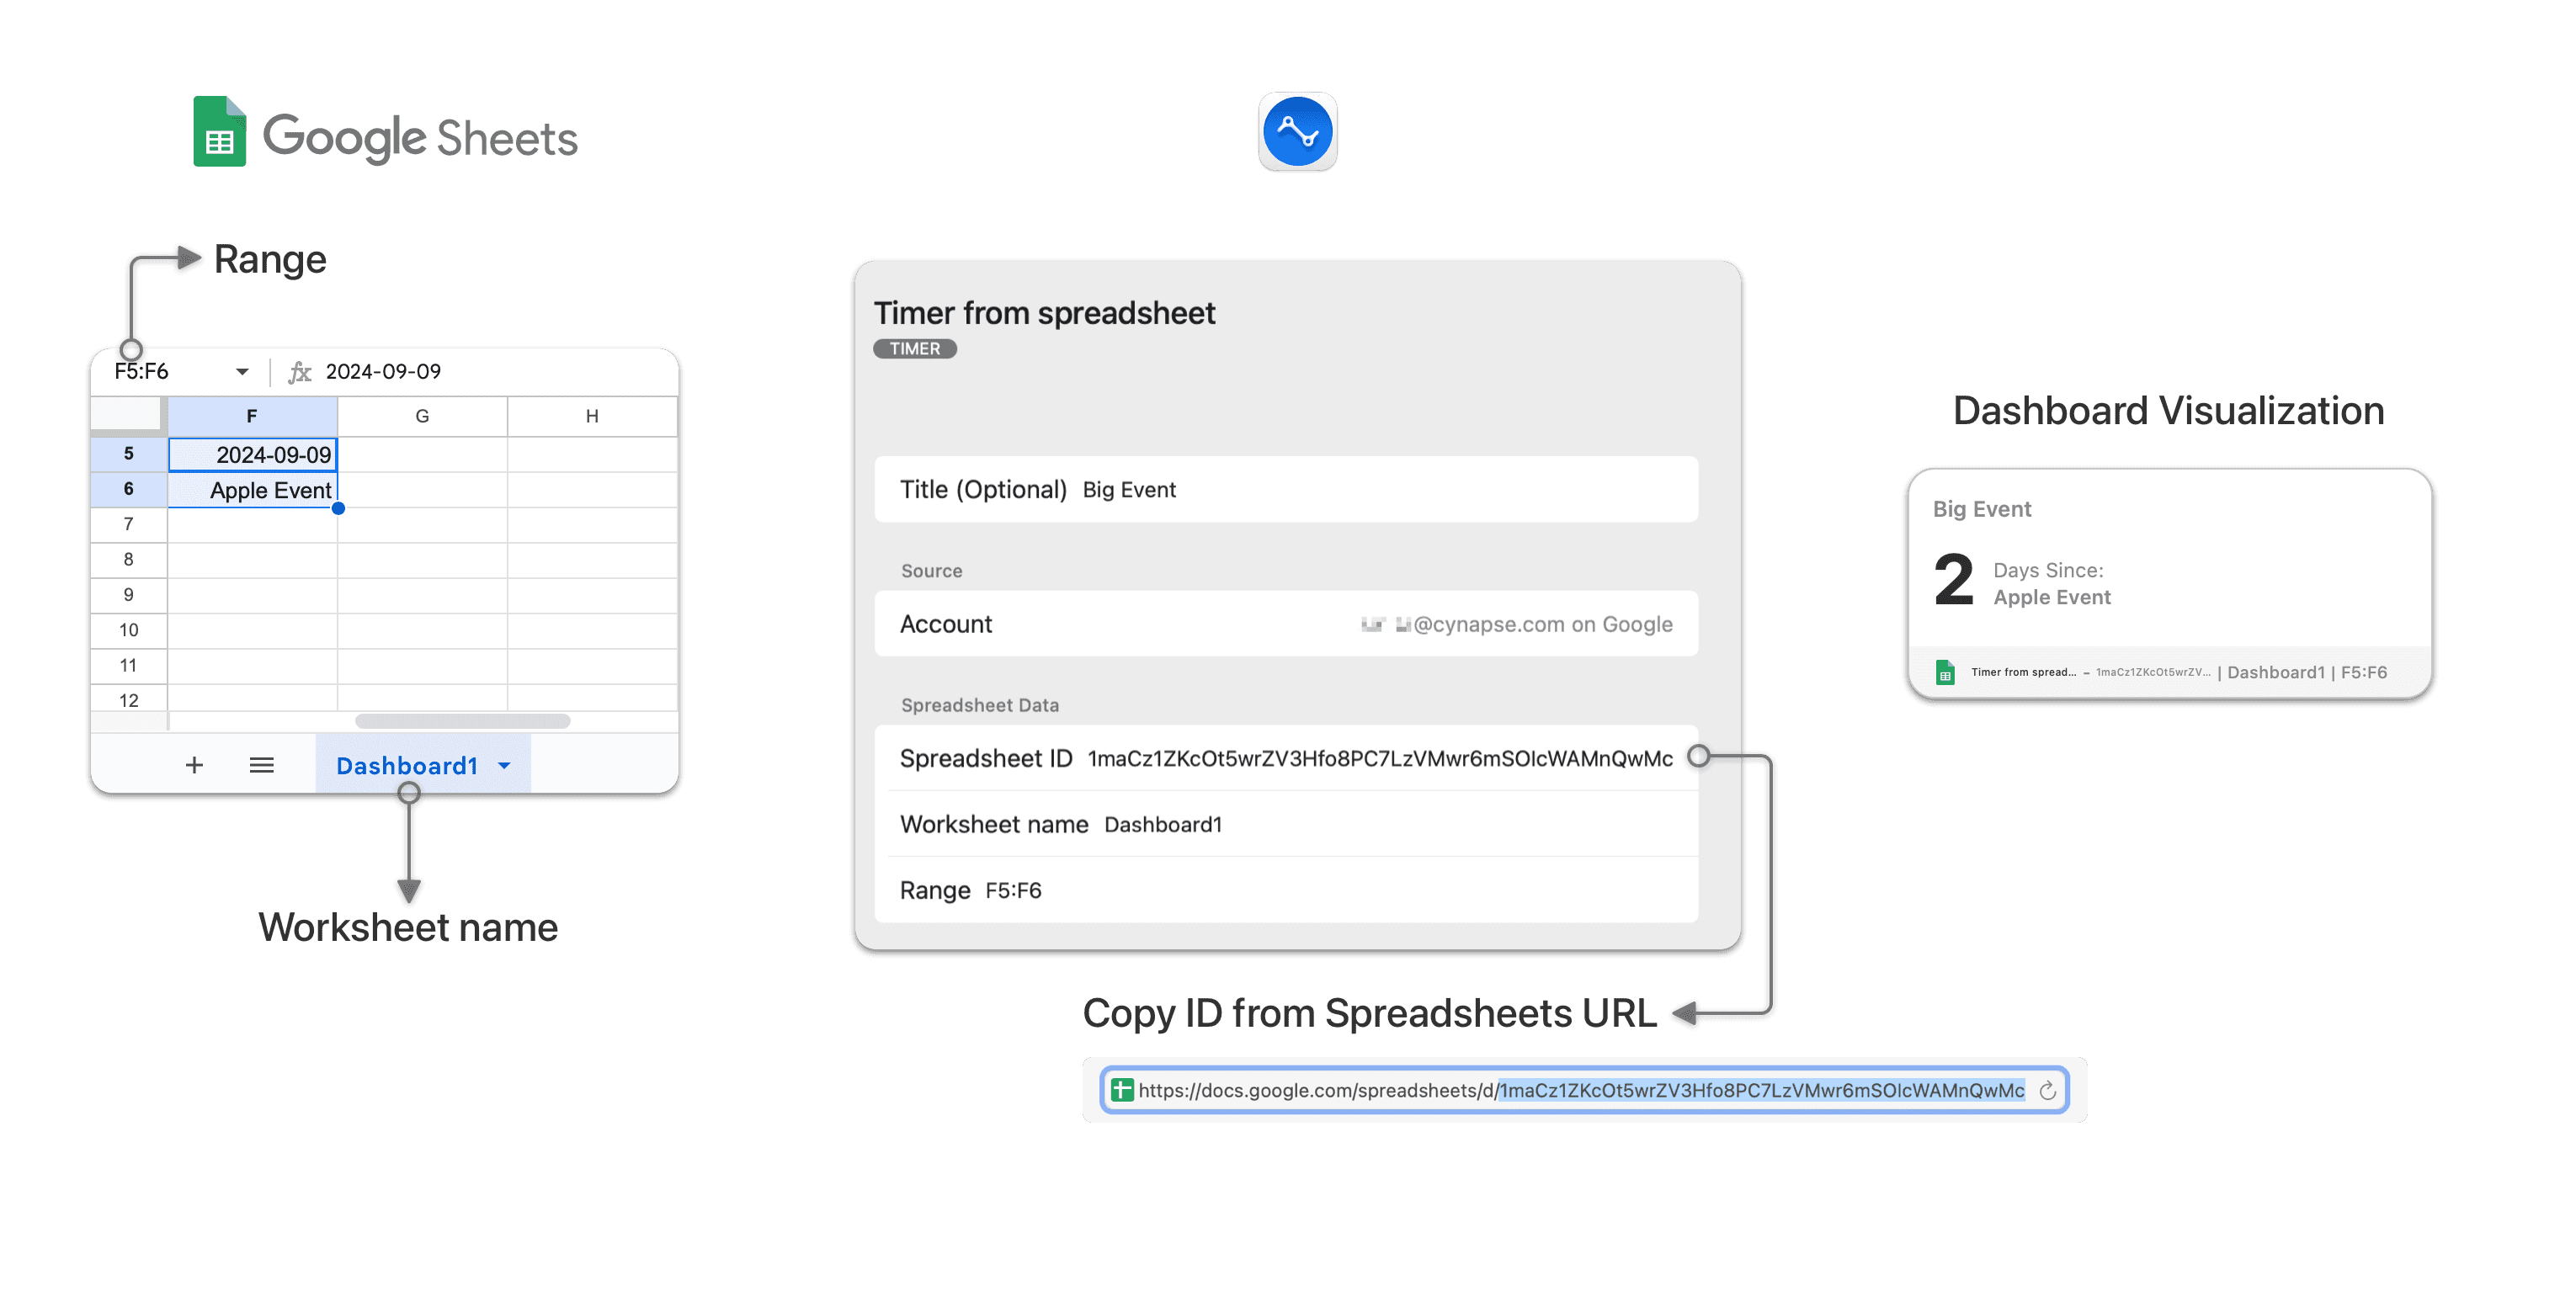
Google Spreadsheets Timer
For the range, specify a 1 column by 2 row range. The first row cell must contain a start date and time value that is used to calculate and display a timer with the time passed since or remaining for the event. The second row will be displayed as the event name near the timer and can be any value including text or number.
For example, if the first row cell of your spreadsheet looks like this:
| 11/06/2020 6:30:00 |
|  Big Launch  |
Adding a range A1:A2, will display a timer with the number of days counting down to the 6th November 2020 with Big Launch as the event title on your dashboard.
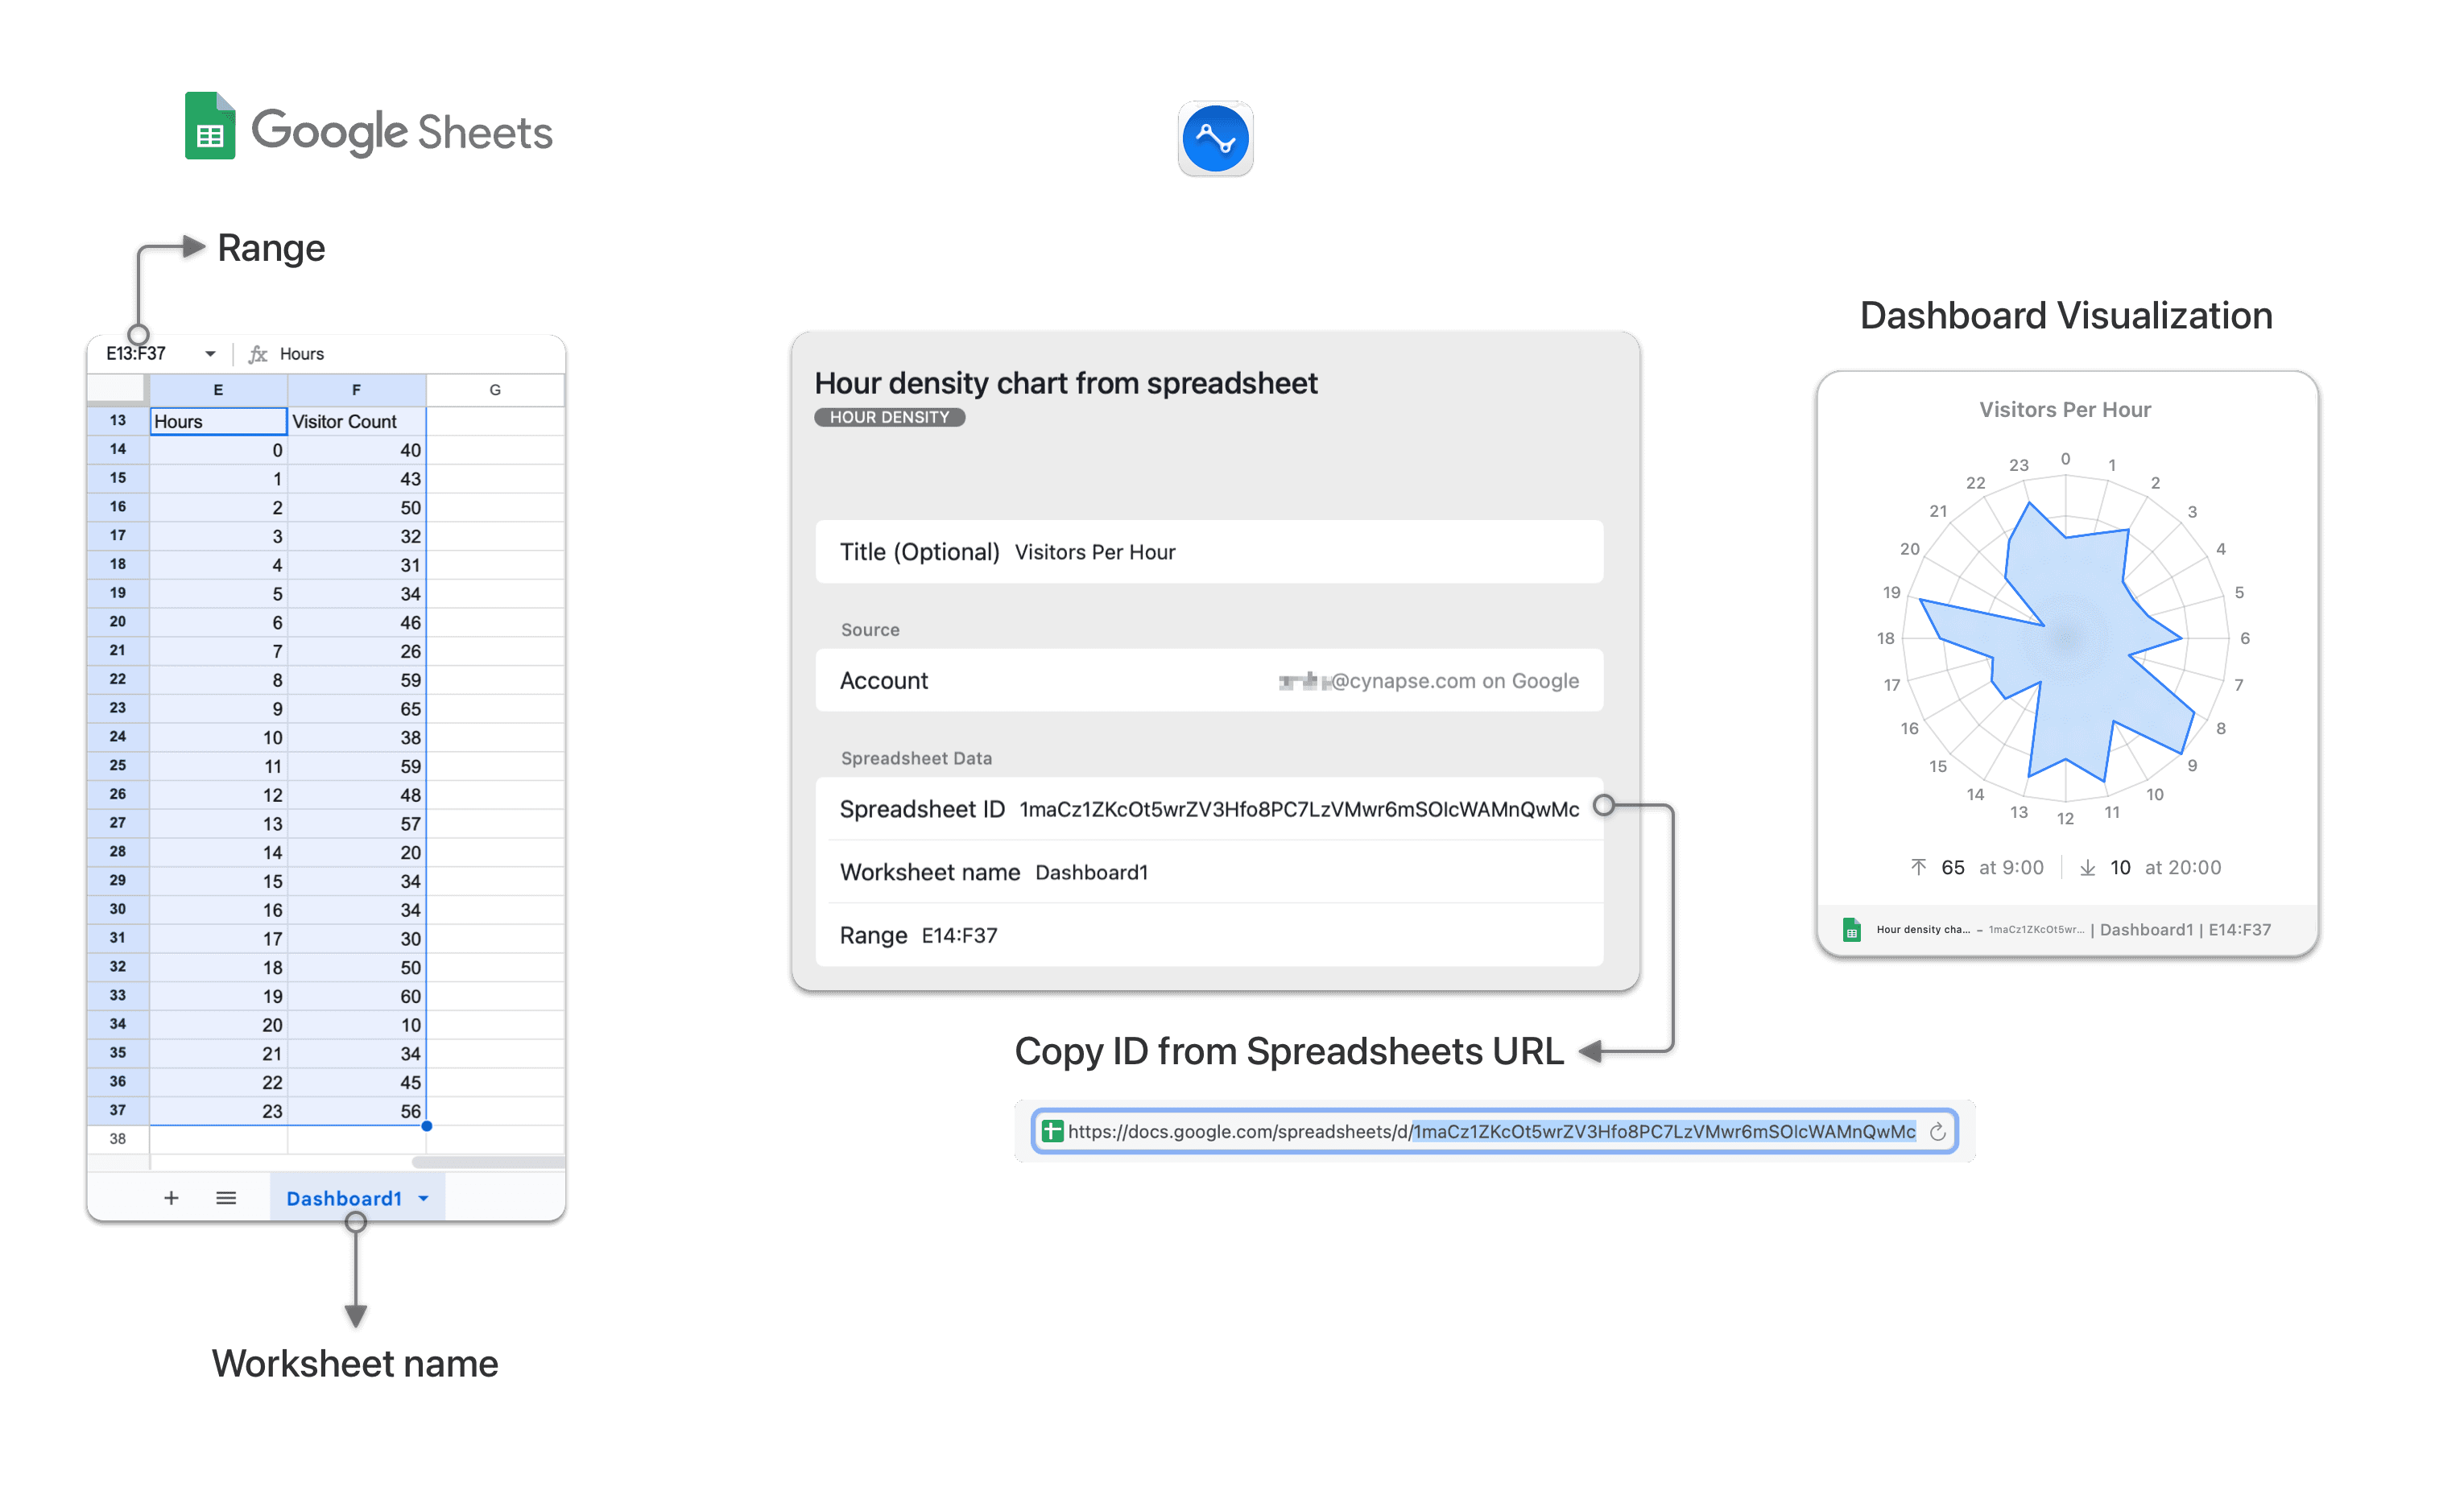
Google Spreadsheets Custom Hour Density Chart
For the range, specify a 2 column by 'n' rows range (max 24). The first column must list the 24 hours of the day and must be a number value between 0 and 24, while the second column must have number values that indicate the value of each hour.
For example, if your spreadsheet looks like this:
| 0 | 600 |
| 1 | 100 |
| 2 | 300 |
| 22 | 88 |
| 23 | 800 |
Adding a range of A1:B23, considering the second column is a count of visitors, the widget will display the density map of visitors across the day.
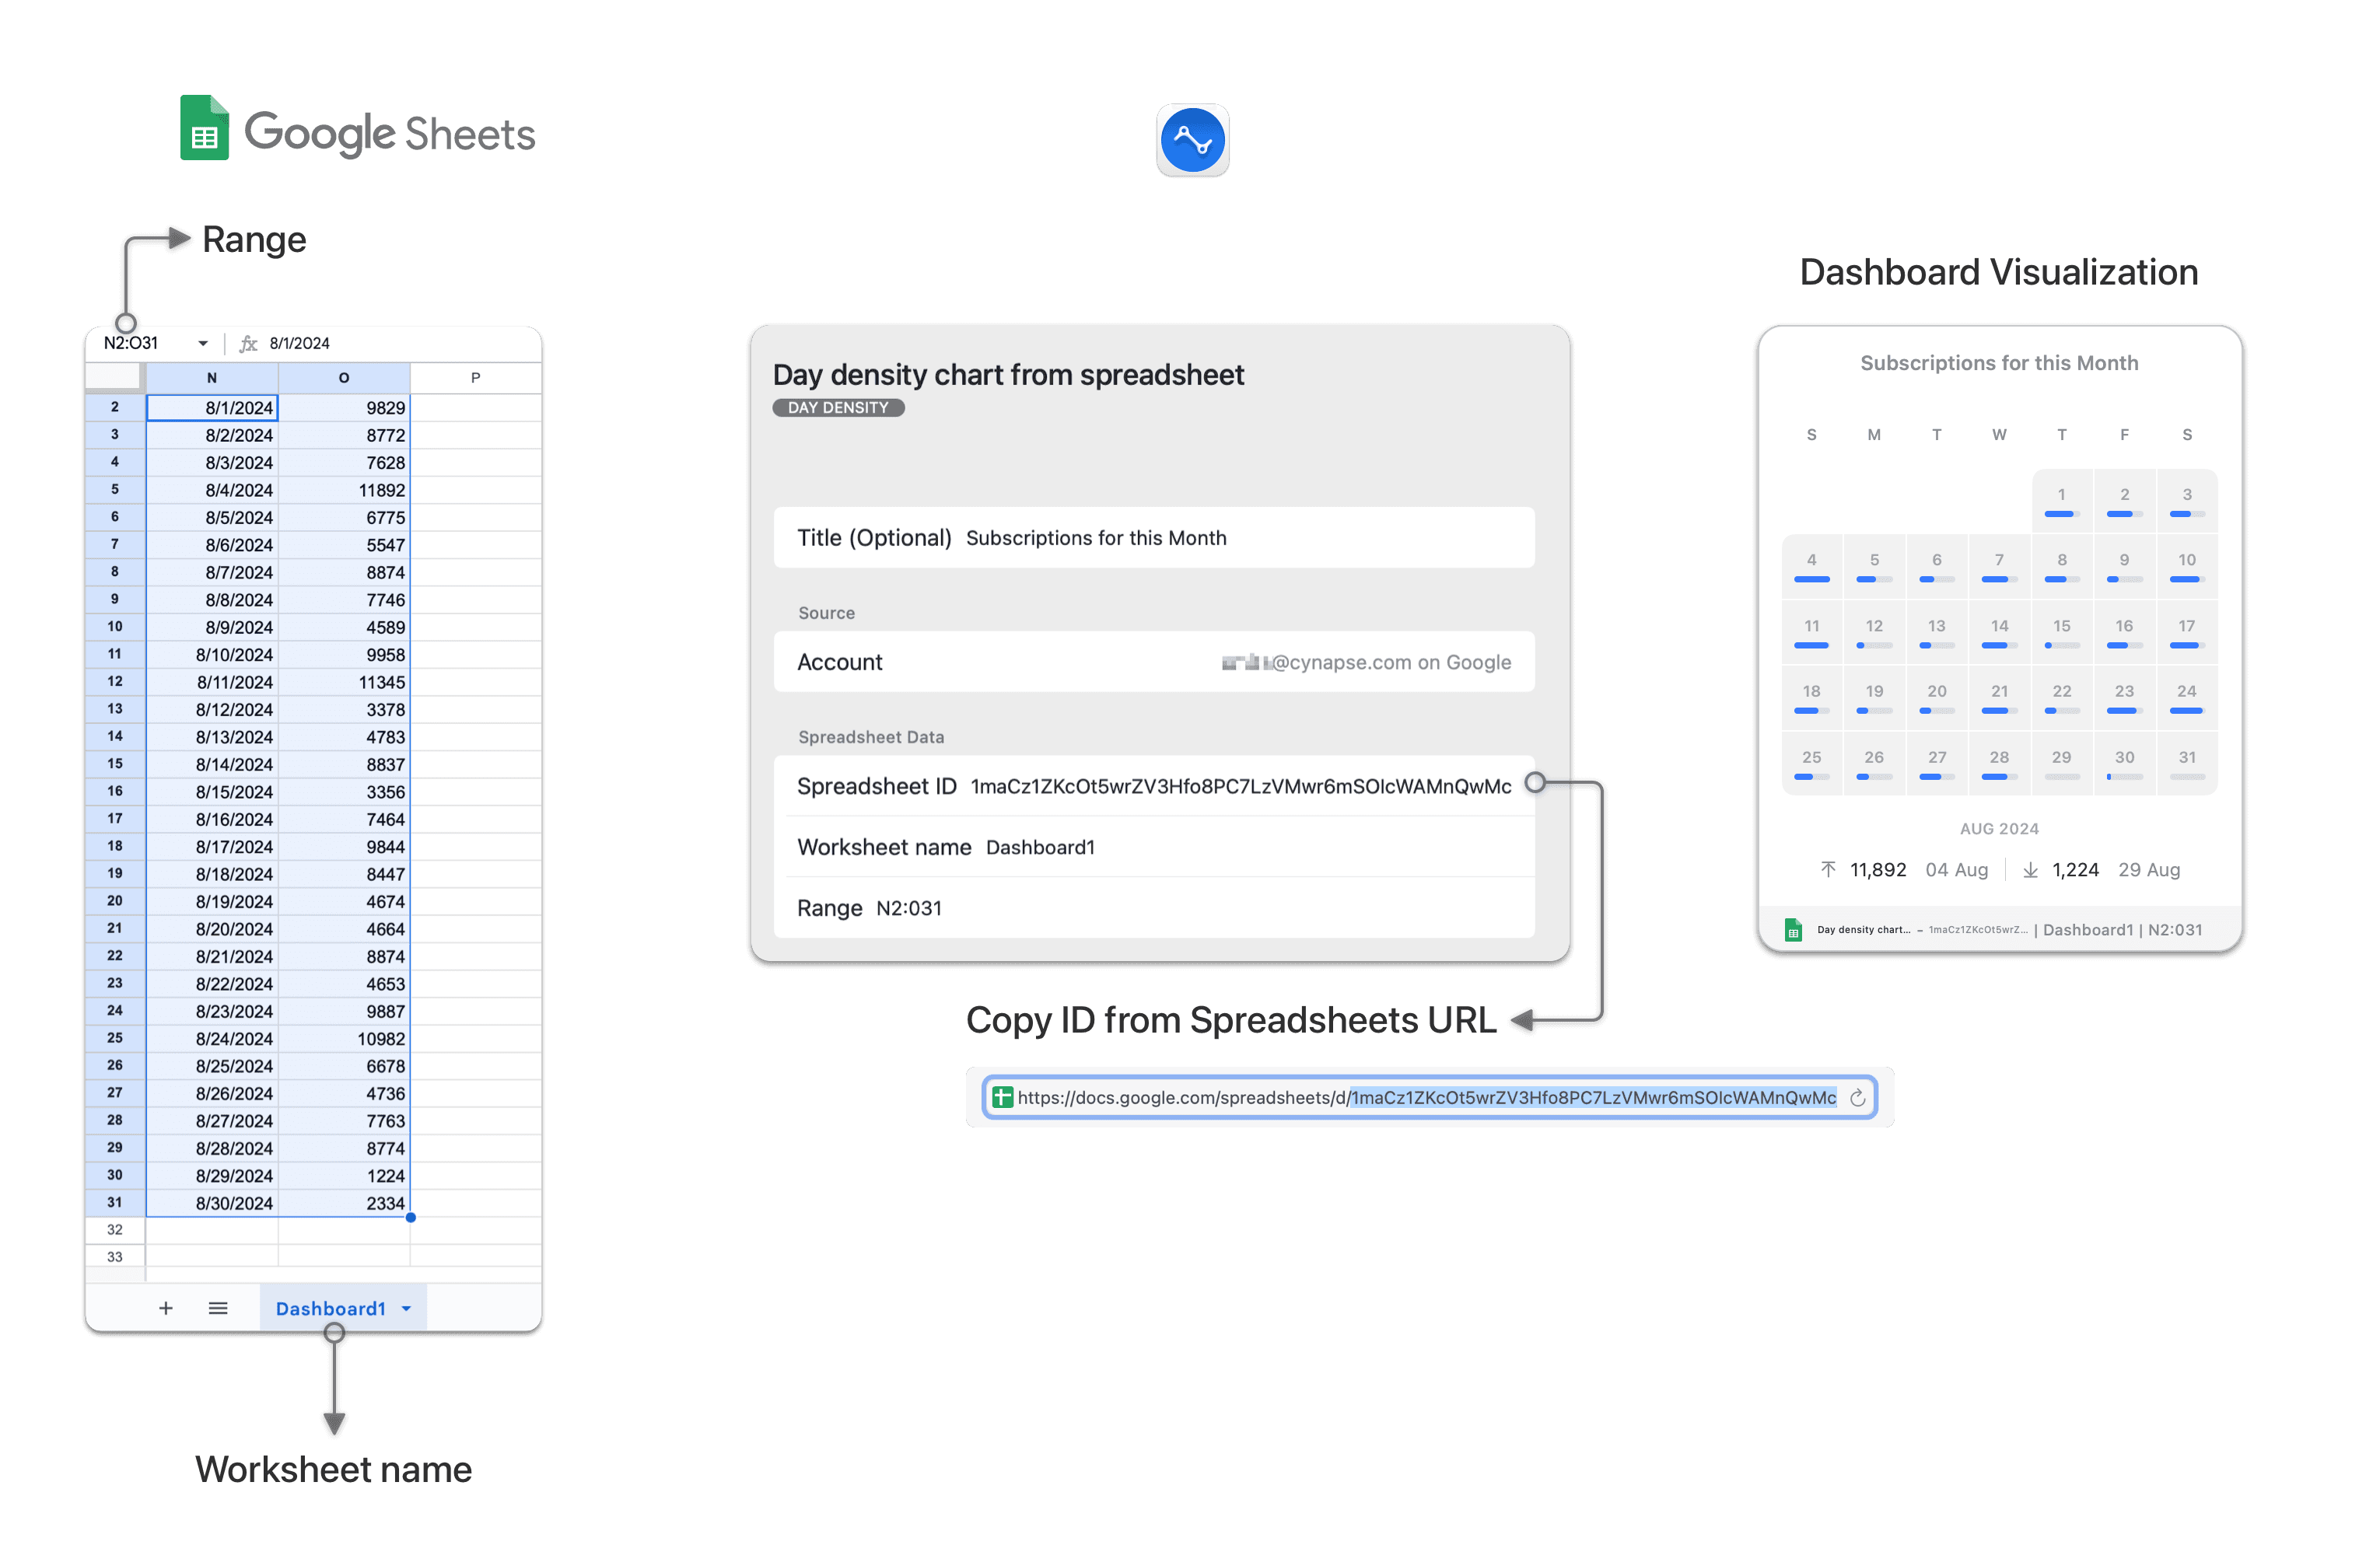
Google Spreadsheets Custom Day Density Chart
For the range, specify a 2 column by 'n' rows range. The first column must list the days of a single month, and must be in date format ddmmyyyy. The second column must have the corresponding number values that indicates the value for the day.
For example, if your spreadsheet looks like this:
| A | B |
| 1/1/2022 | 400 |
| 2/1/2022 | 700  |
| 3/1/2022 | 1001 |
| 31/1/2022 | 600 |
Adding a range of A1:B31, will display the density of sales over the days of the month.