Tableau
Design custom dashboards with data from Tableau.
Numerics lets you easily display custom data from Tableau.
Tableau widgets are designed to render information from custom Tableau worksheets. To display widgets in Numerics, the Tableau worksheets need to be customized by using fields from the data pane and by building the structure using Marks, Columns and Rows as specified by the Numerics Widget Data Specification.
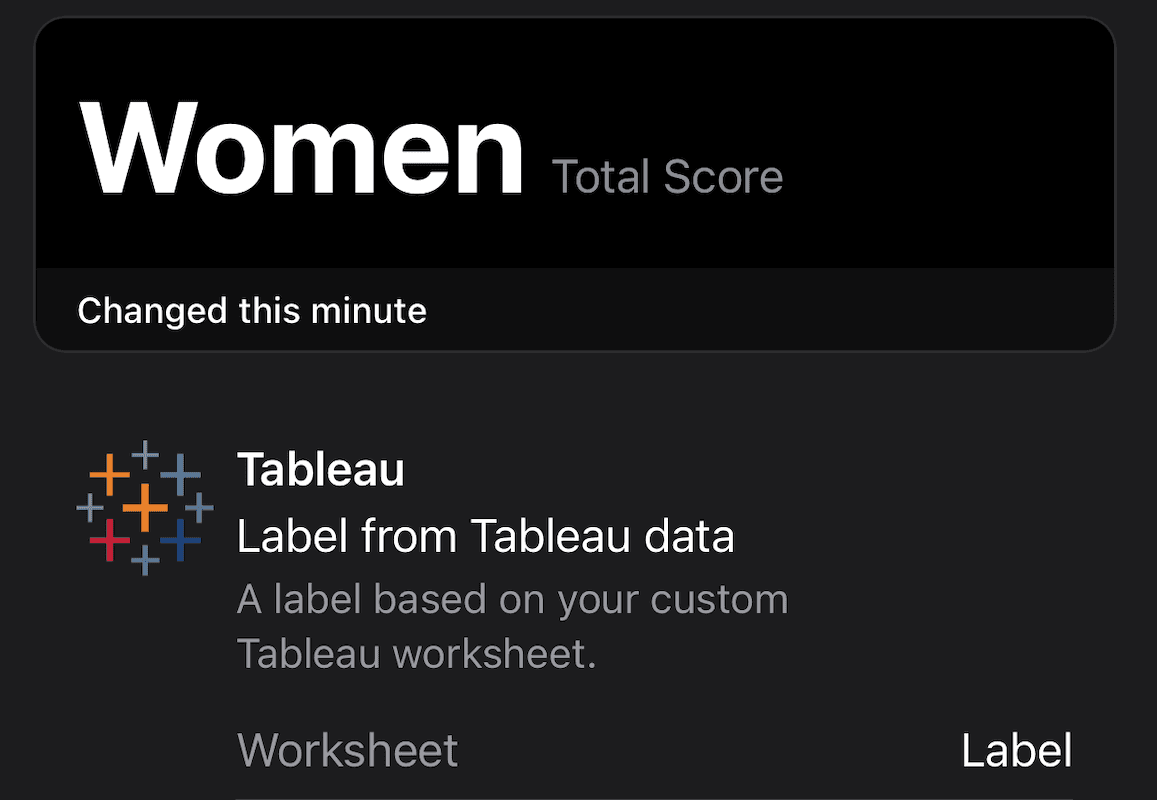
Label from Tableau data
For a label widget, drag a measure and a dimension to the Marks card or to Rows/Columns section.
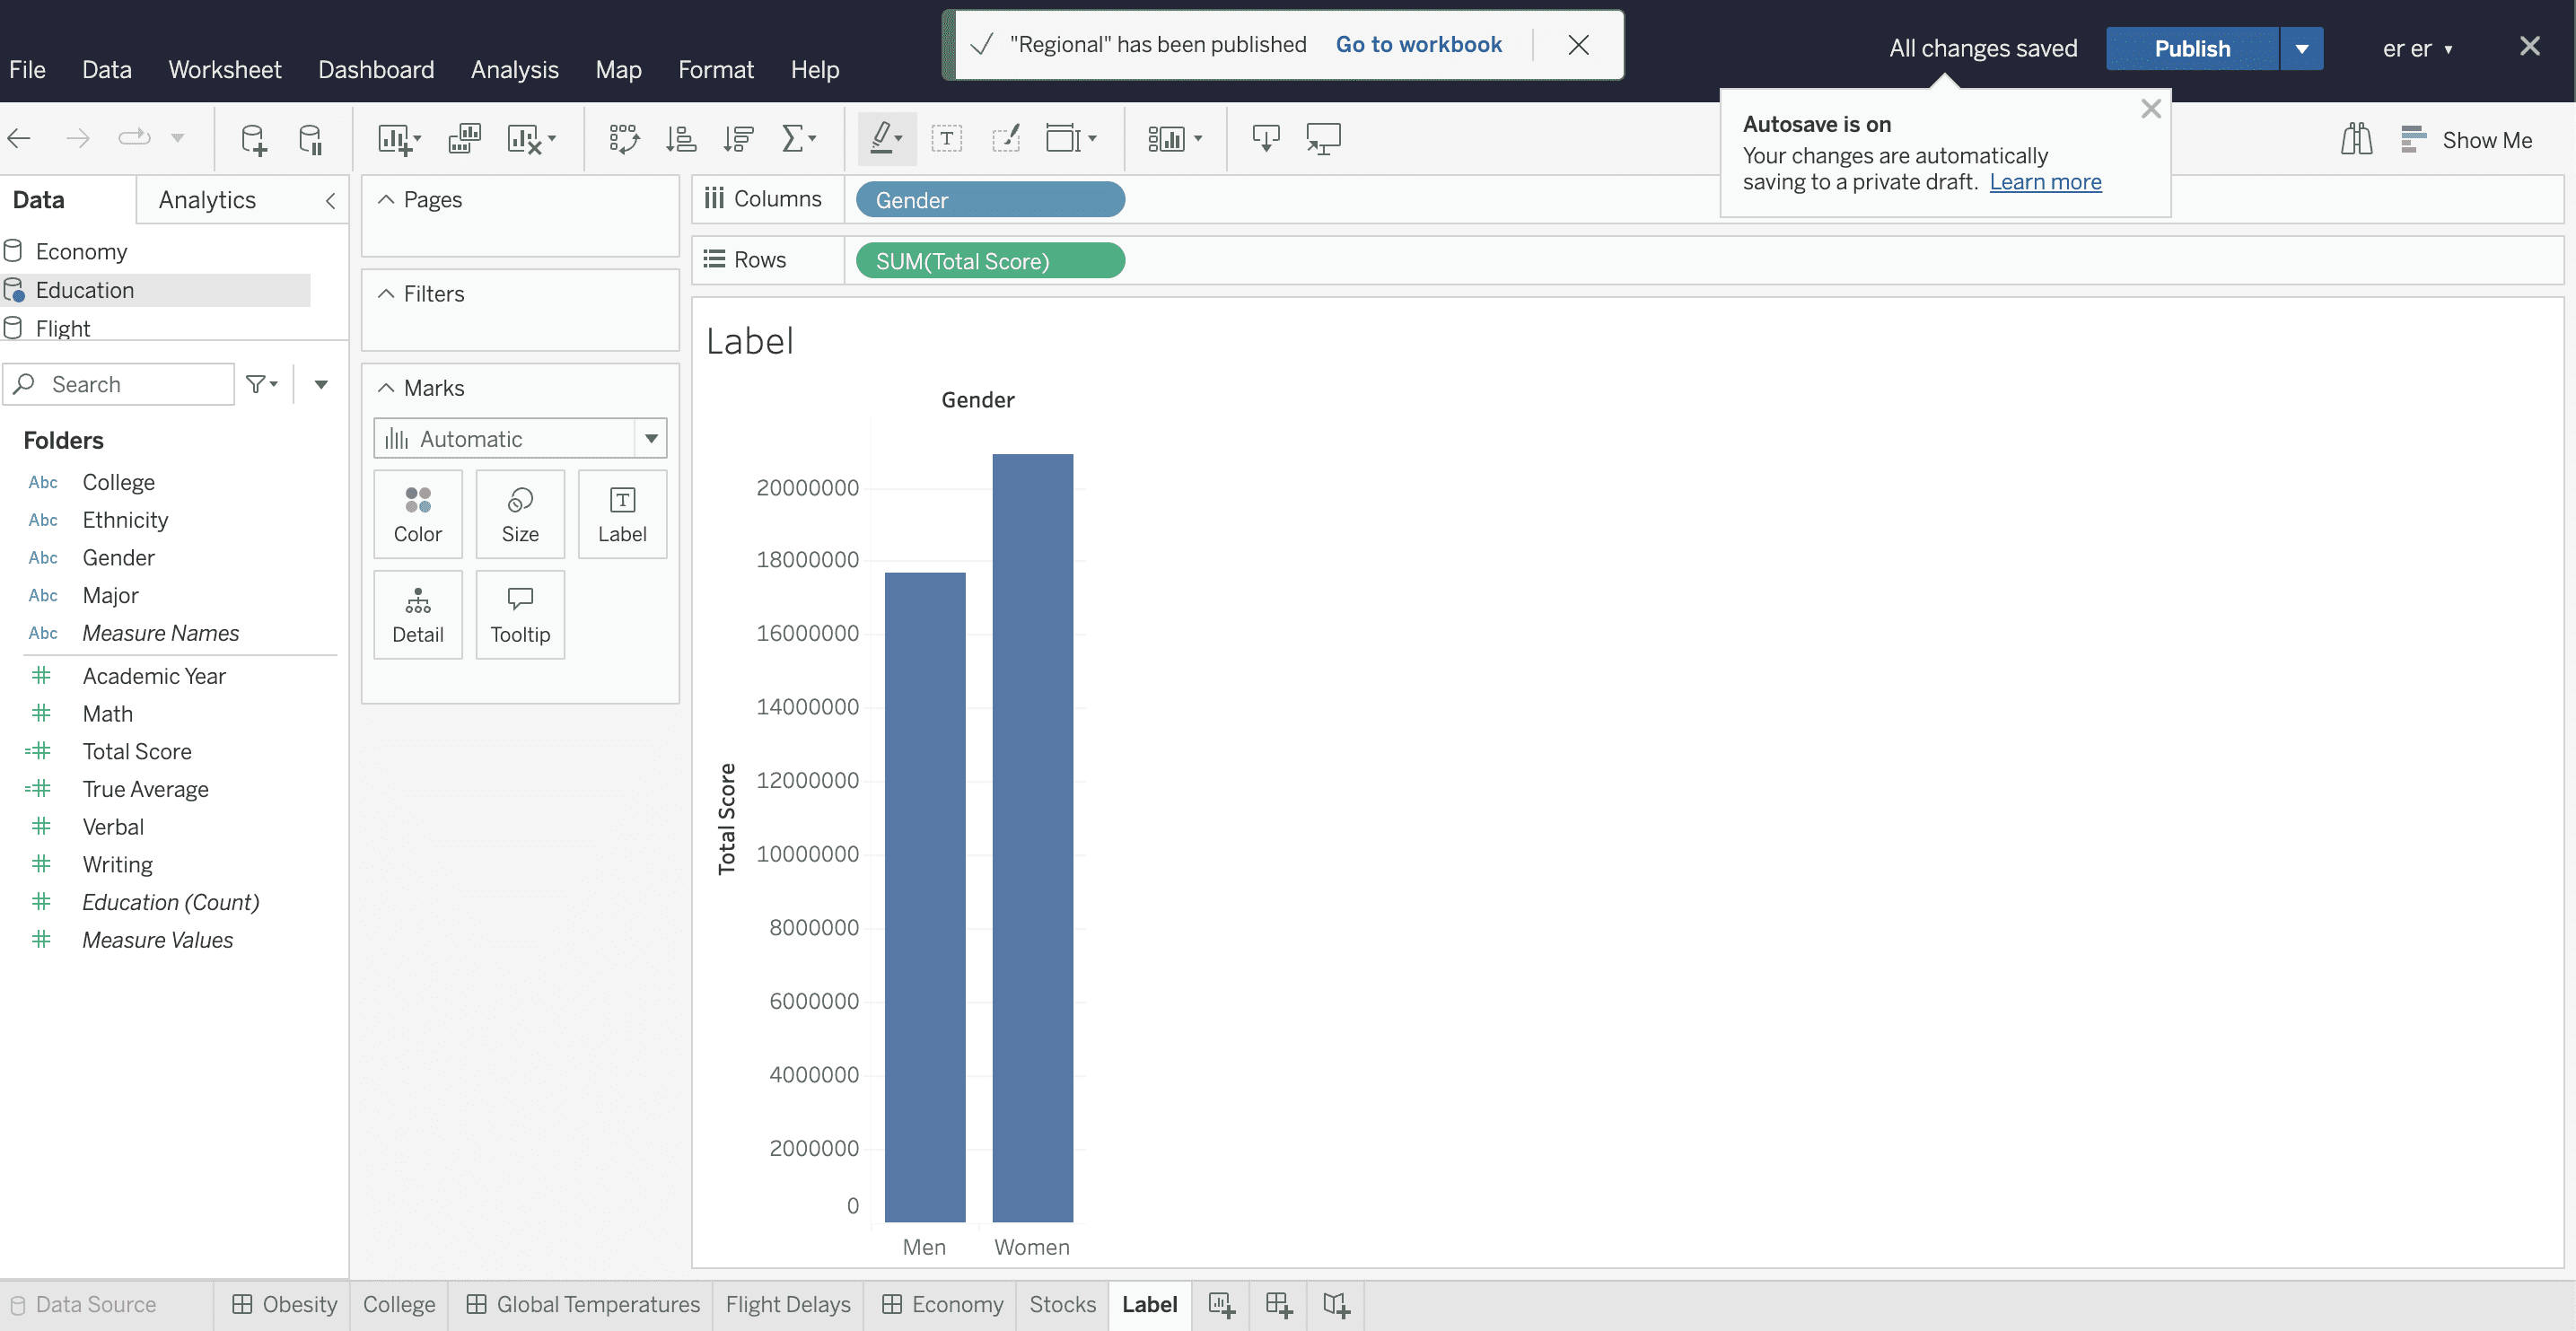
Select the dimension and limit it as per your request to have only one single Dimension vlaue. The sheet will automatically show the Dimension for the chosen Measure. Similar to the example below, you can filter the data to order the results by descending value and limit it to have only 1 result so that you could have highest scoring gender plotted on the graph. Save and publish the worksheet when you are done.
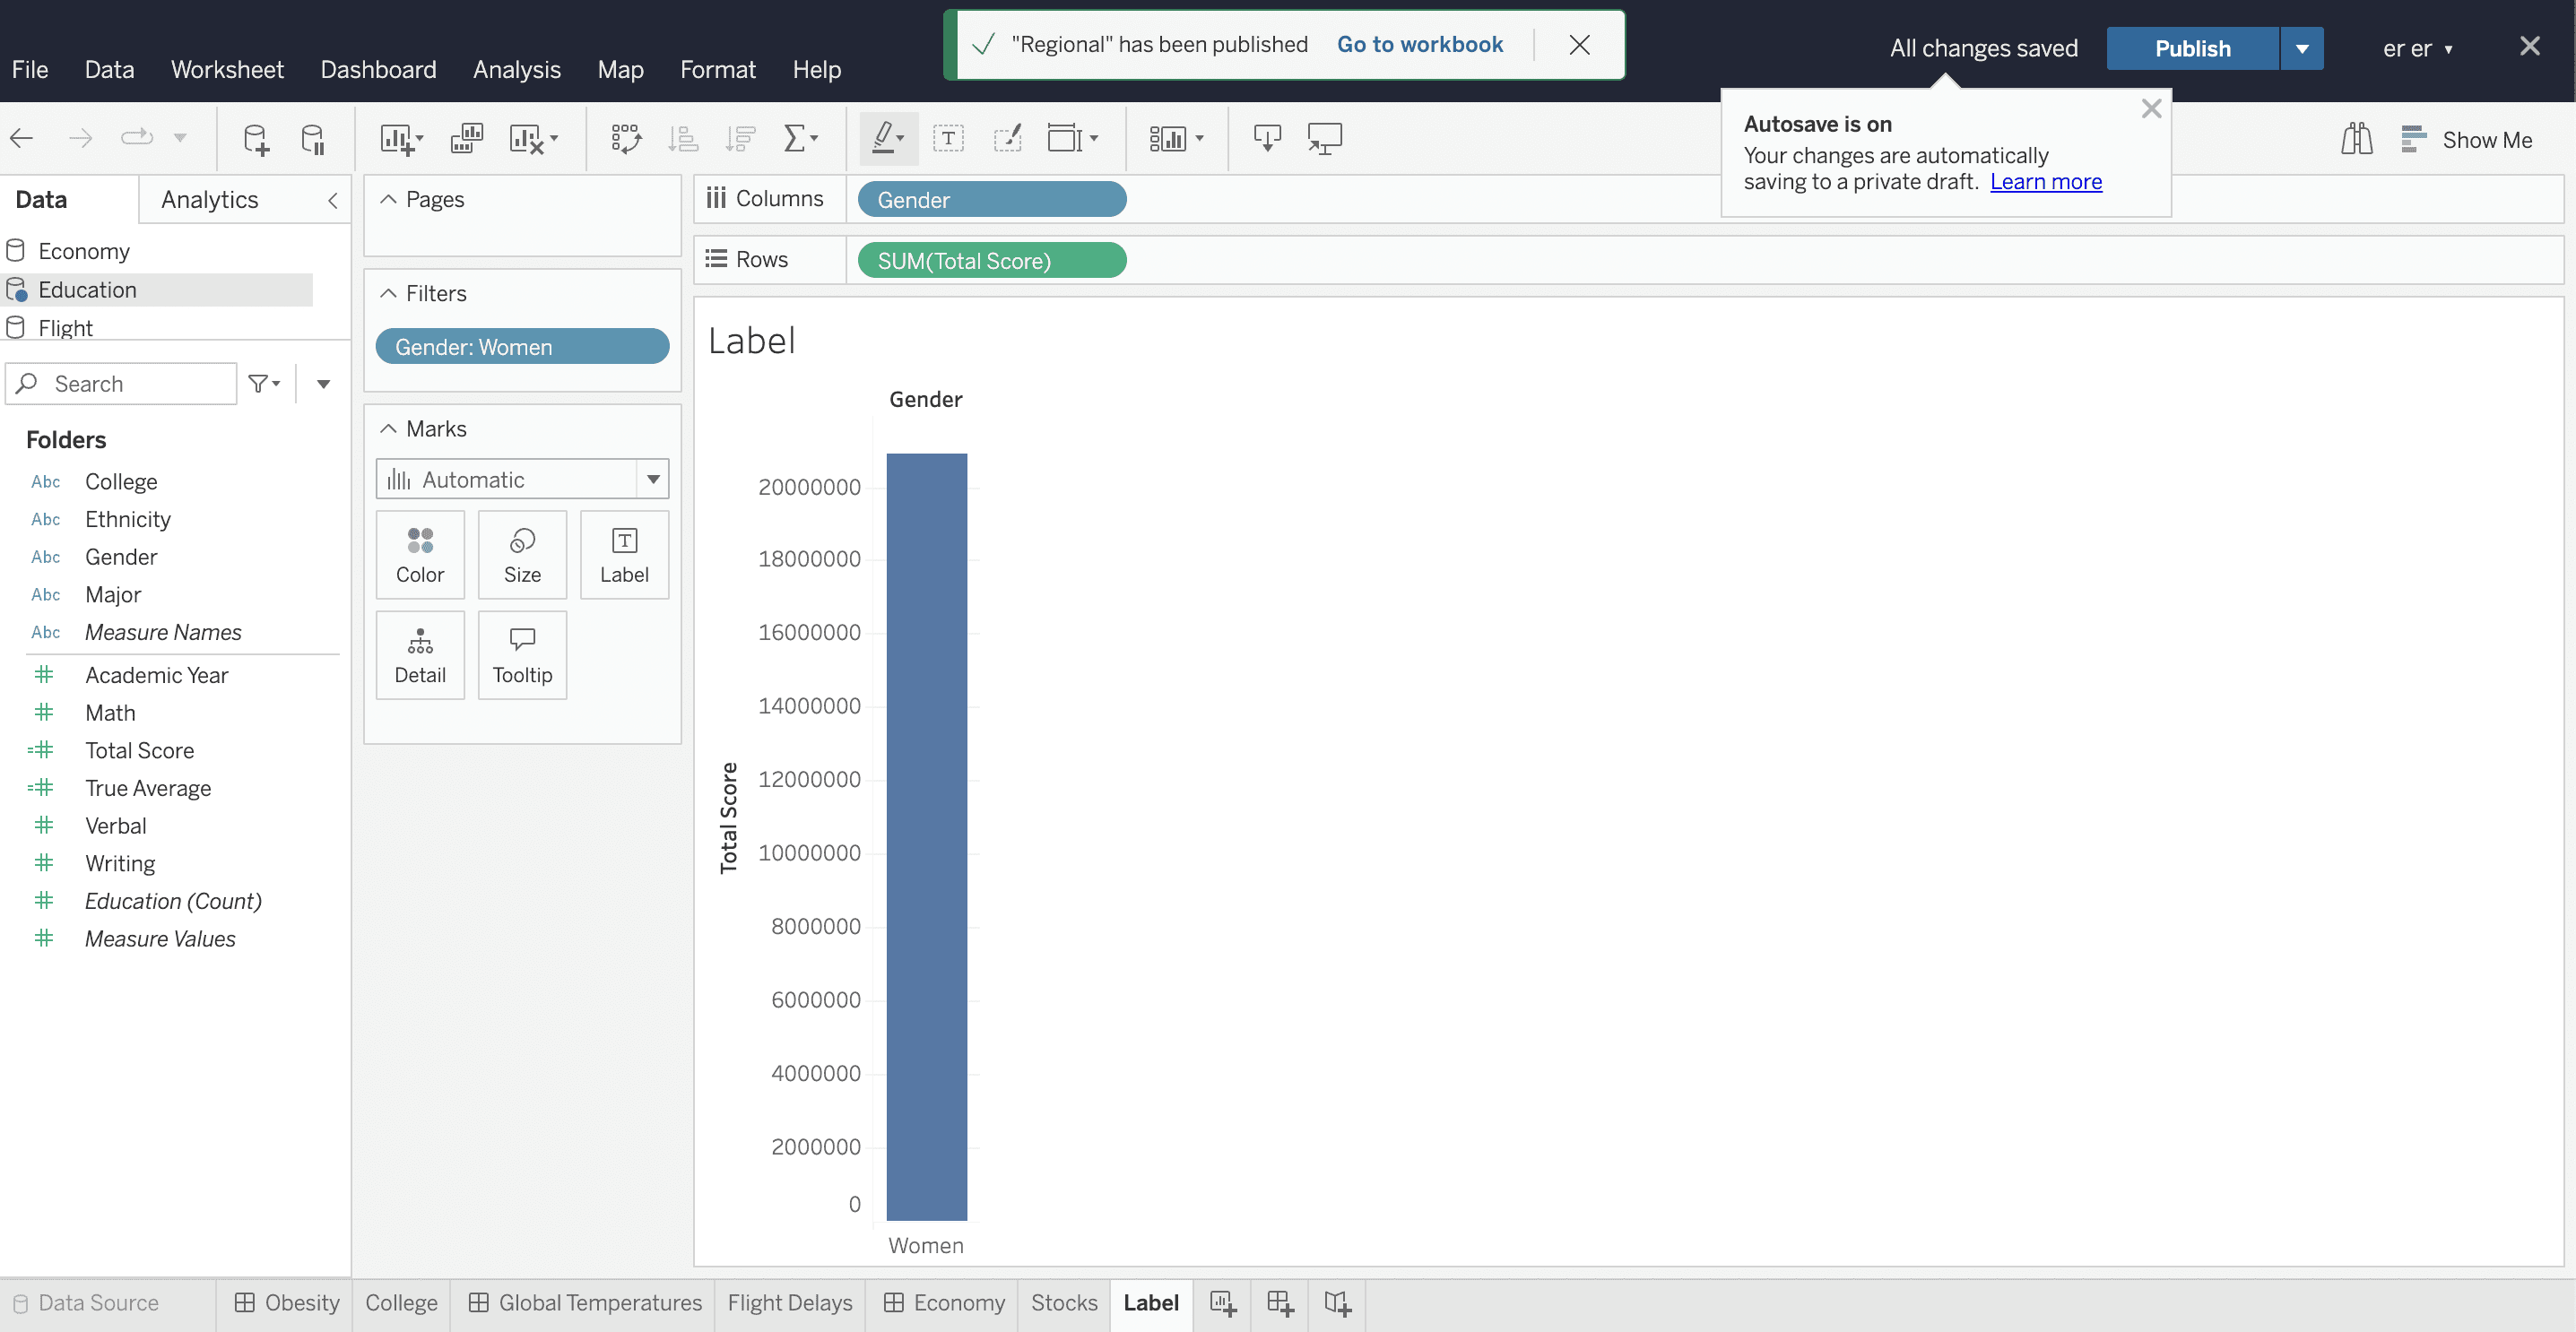
In the widget, choose the saved worksheet to see the Dimension text value along with its Measure name as postfix.
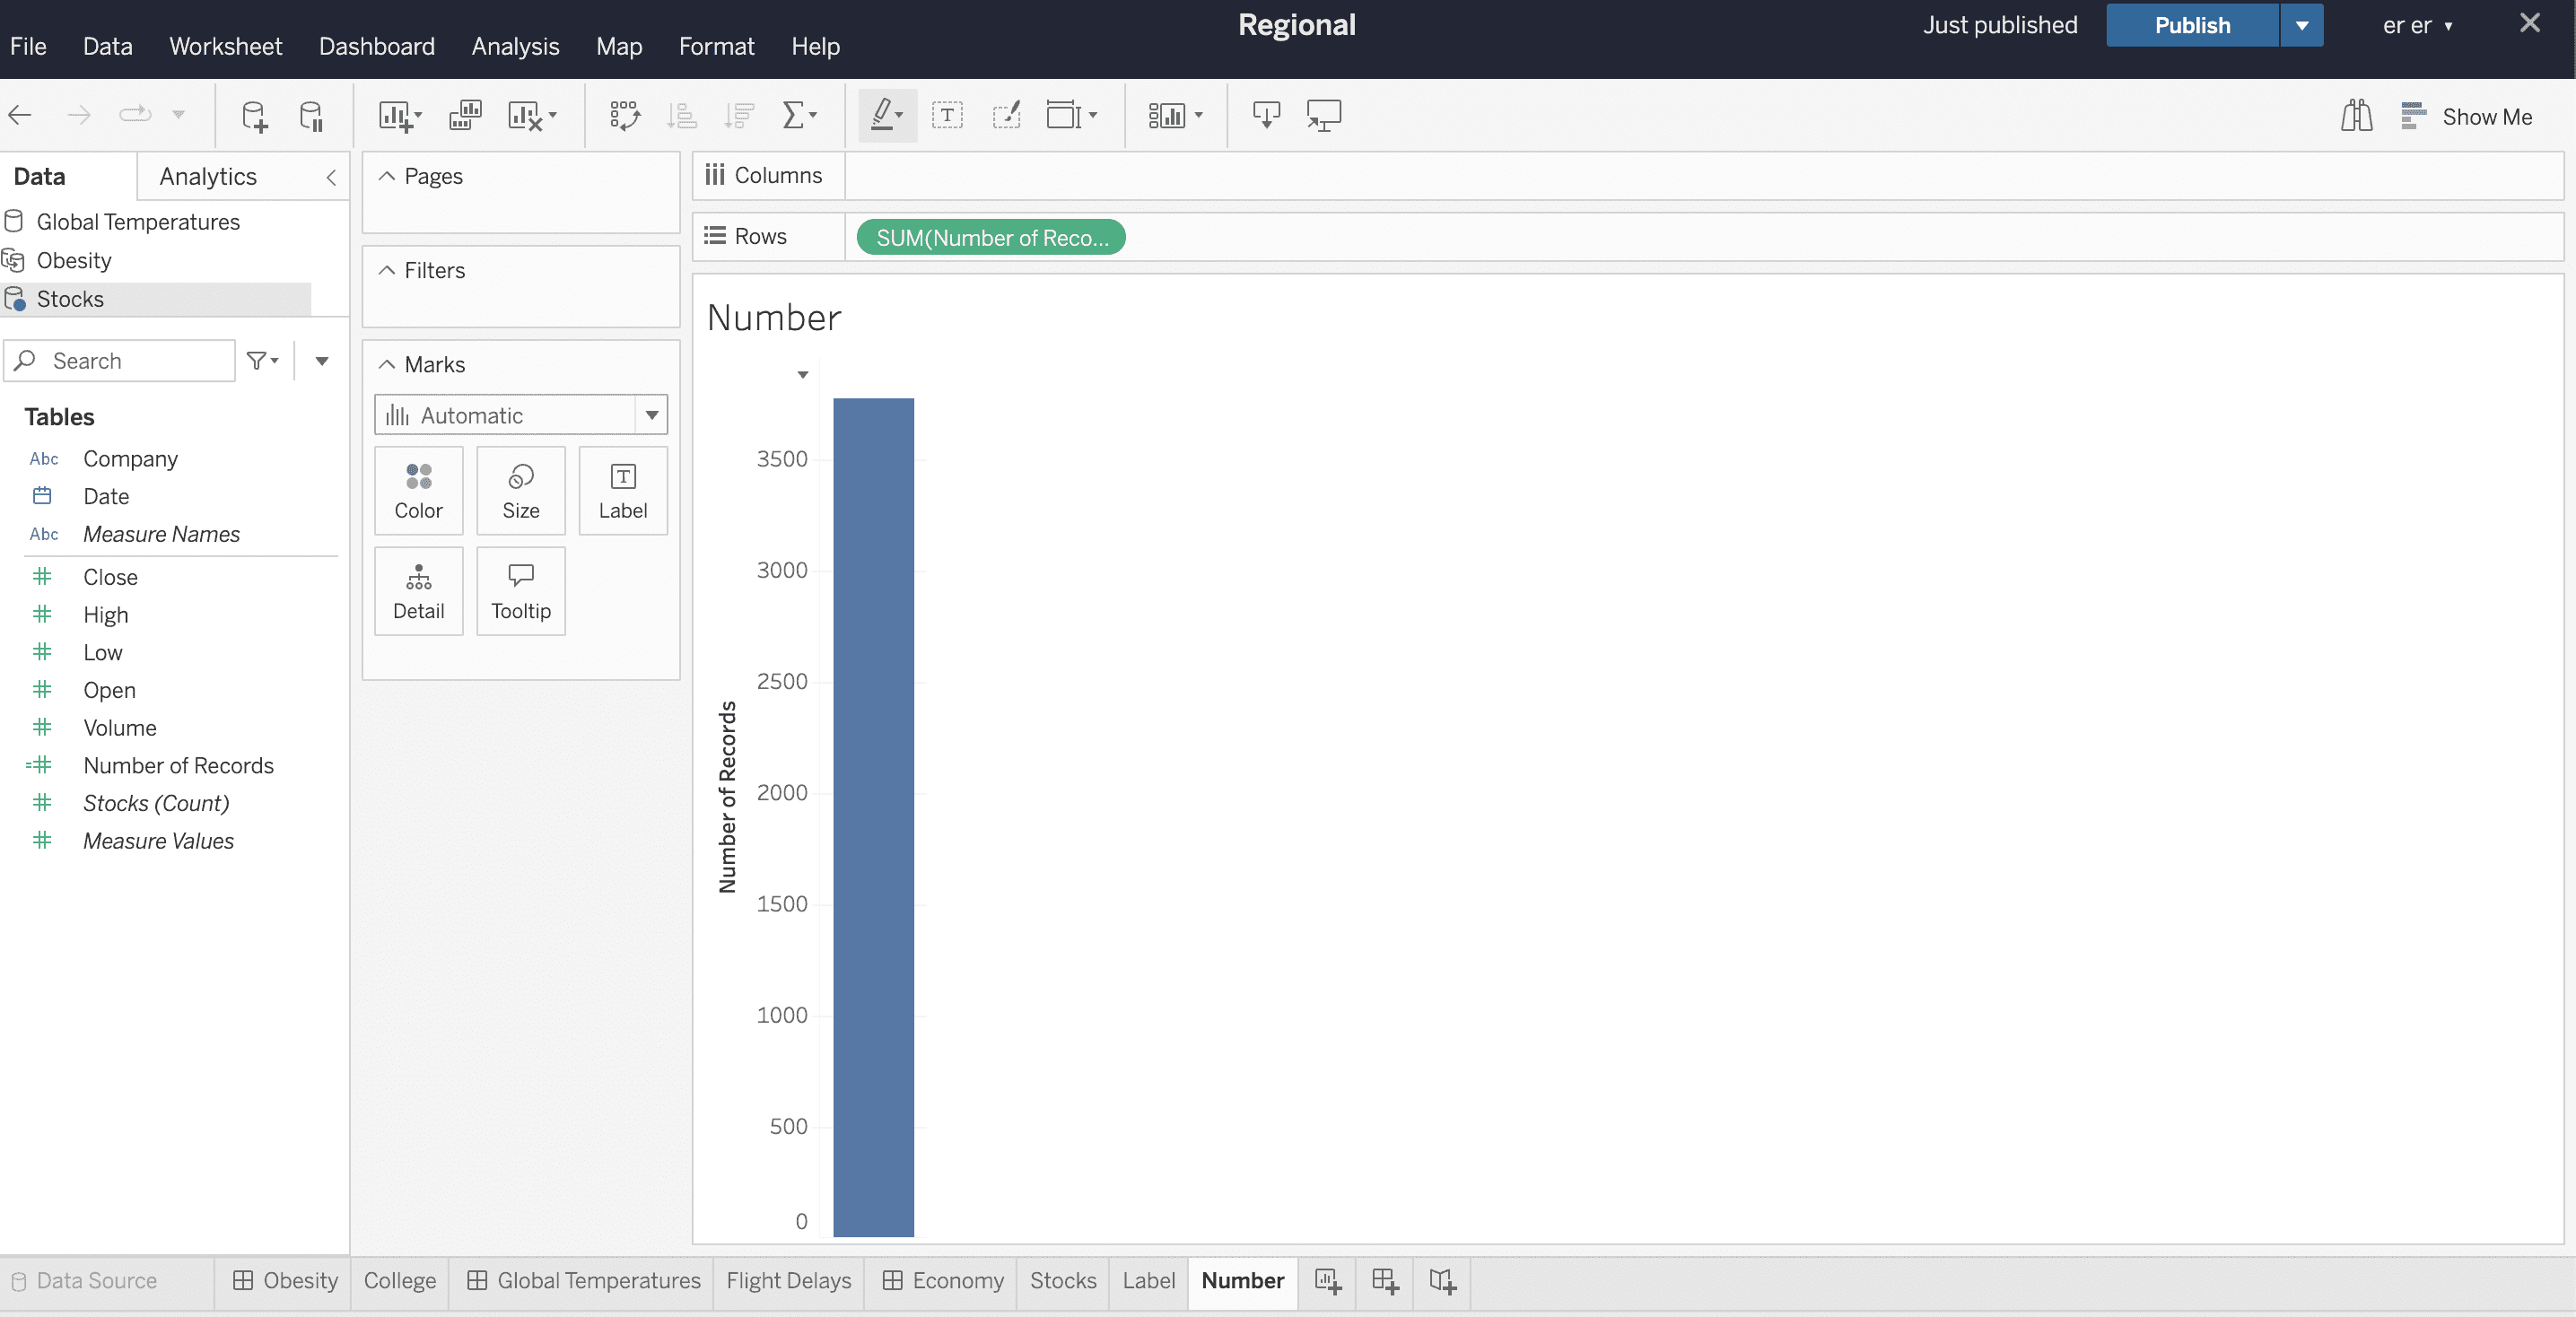
Numer from Tableau data
For a number widget, drag a Measure to the Rows/Columns section such that a single measure is chosen. The sheet will automatically show the data for the Measure.
If you want the number value for a specific Dimension, select the Dimension and limit it as per your request to have only one single Dimension vlaue. The sheet will automatically show the Dimension for the chosen Measure. Similar to the example below, you can filter the data to order the results by descending value and limit it to have only 1 result so that you could have highest number of records by company plotted on the graph. Save and publish the worksheet when you are done.
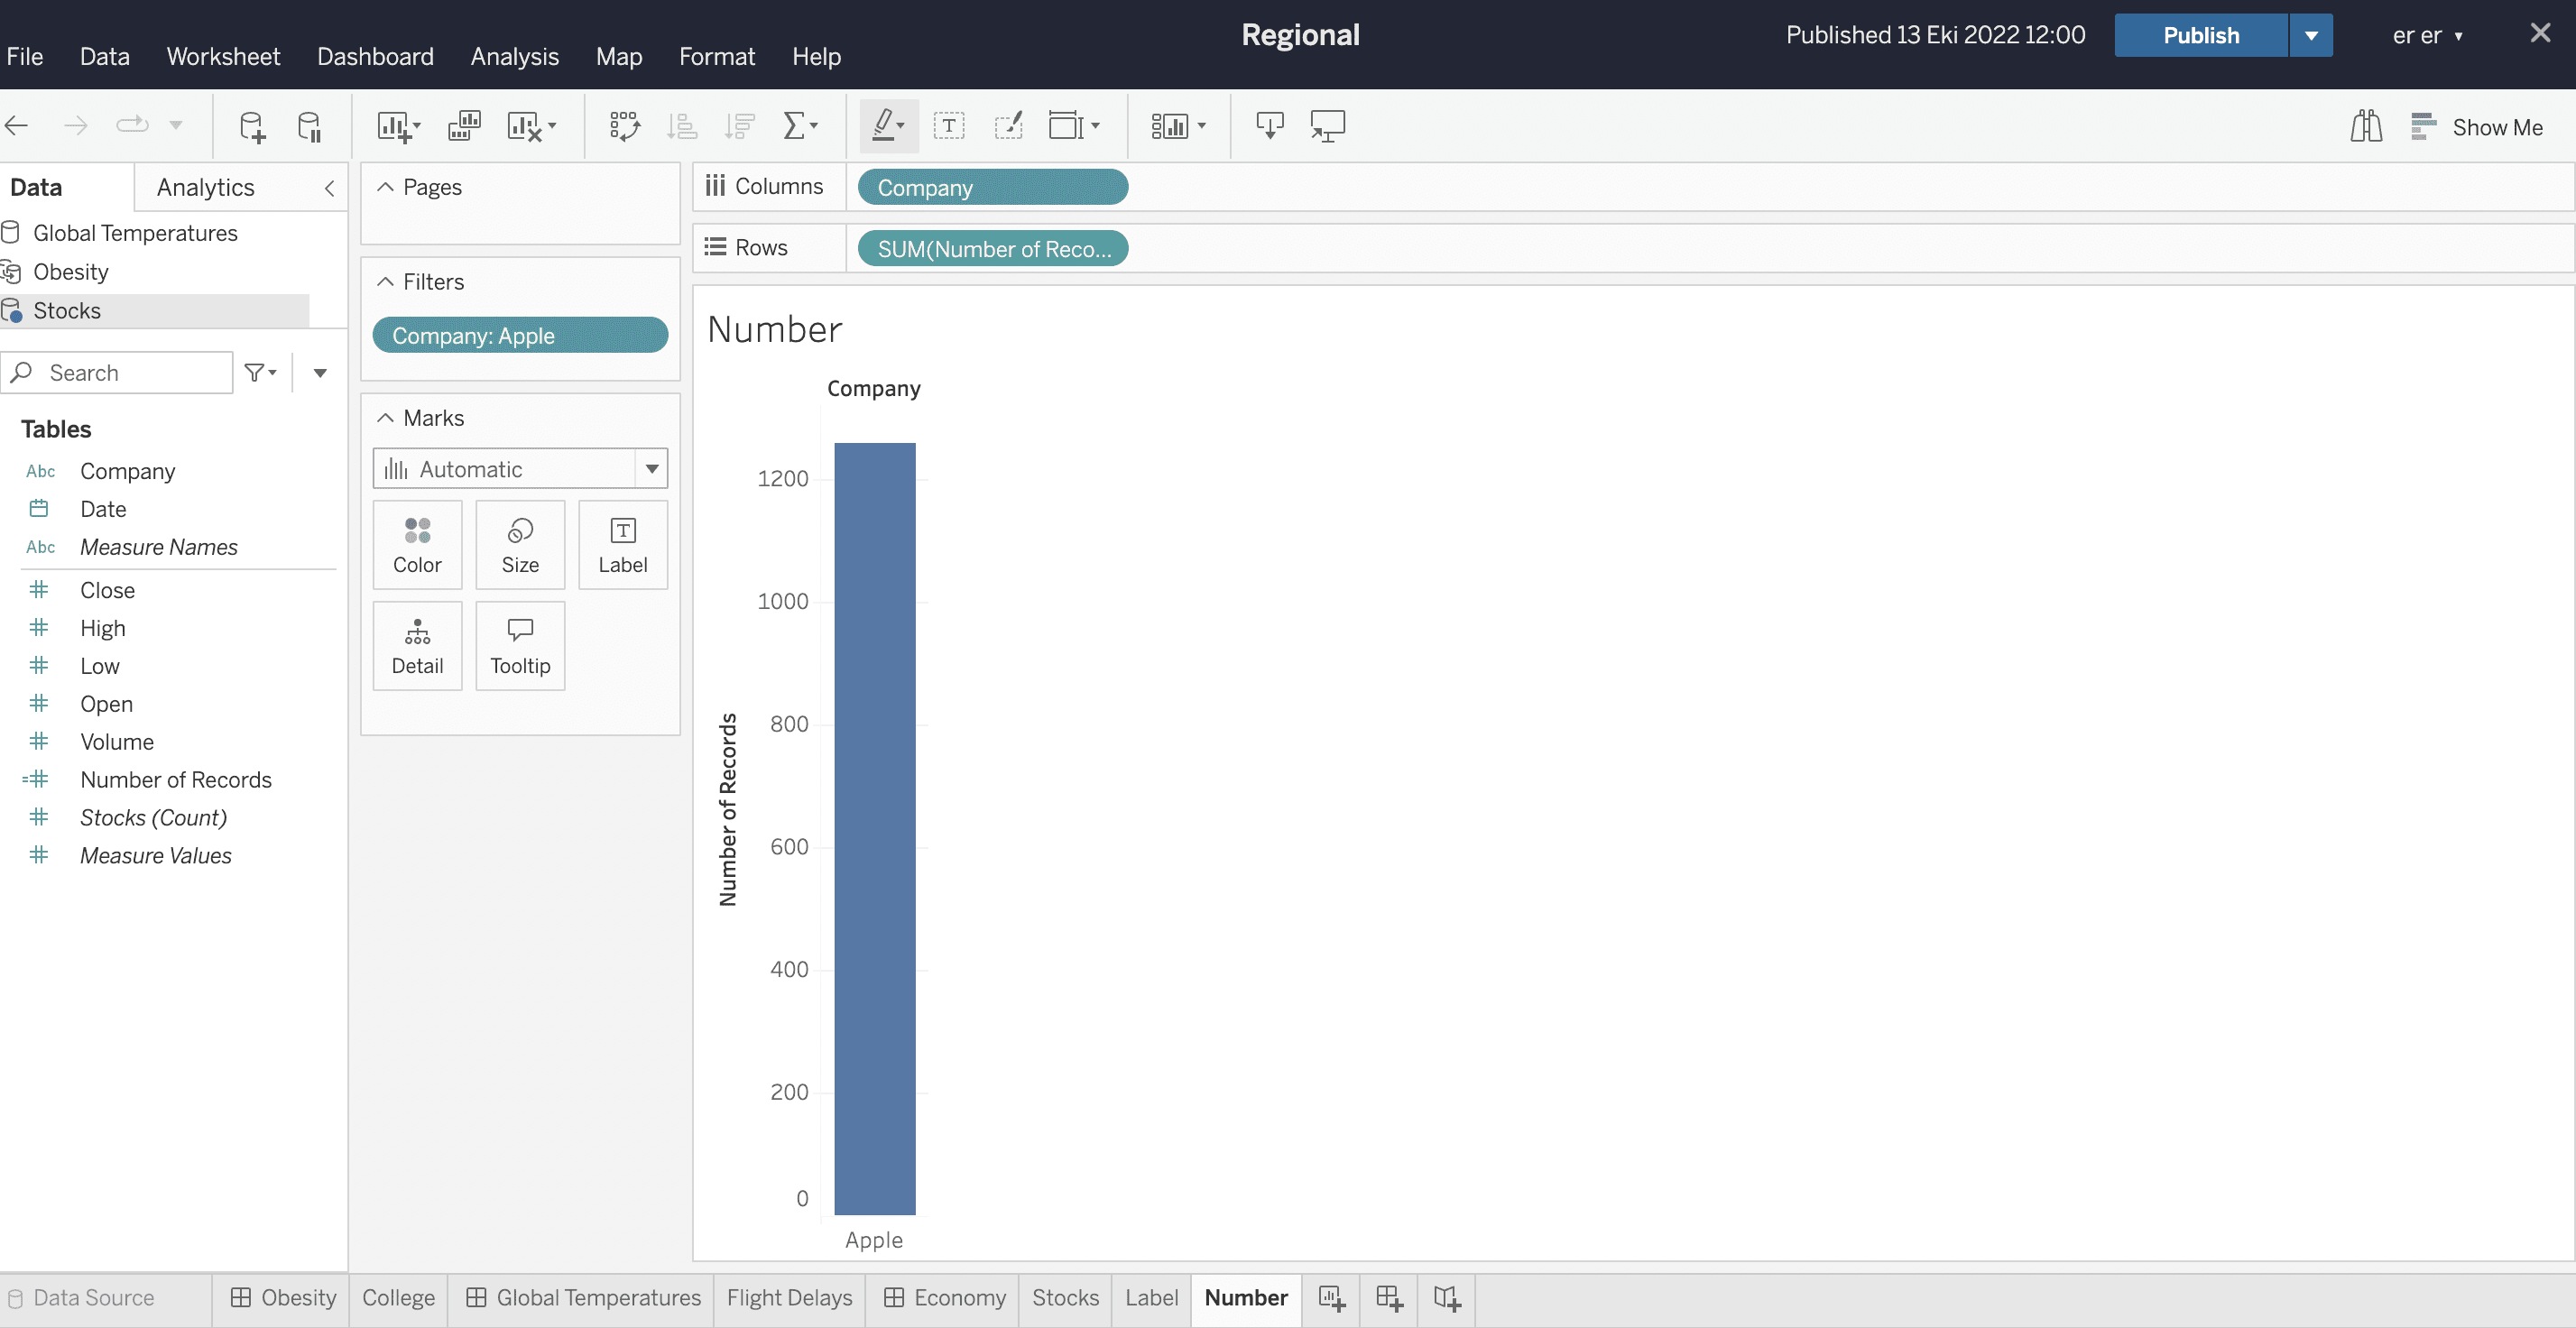
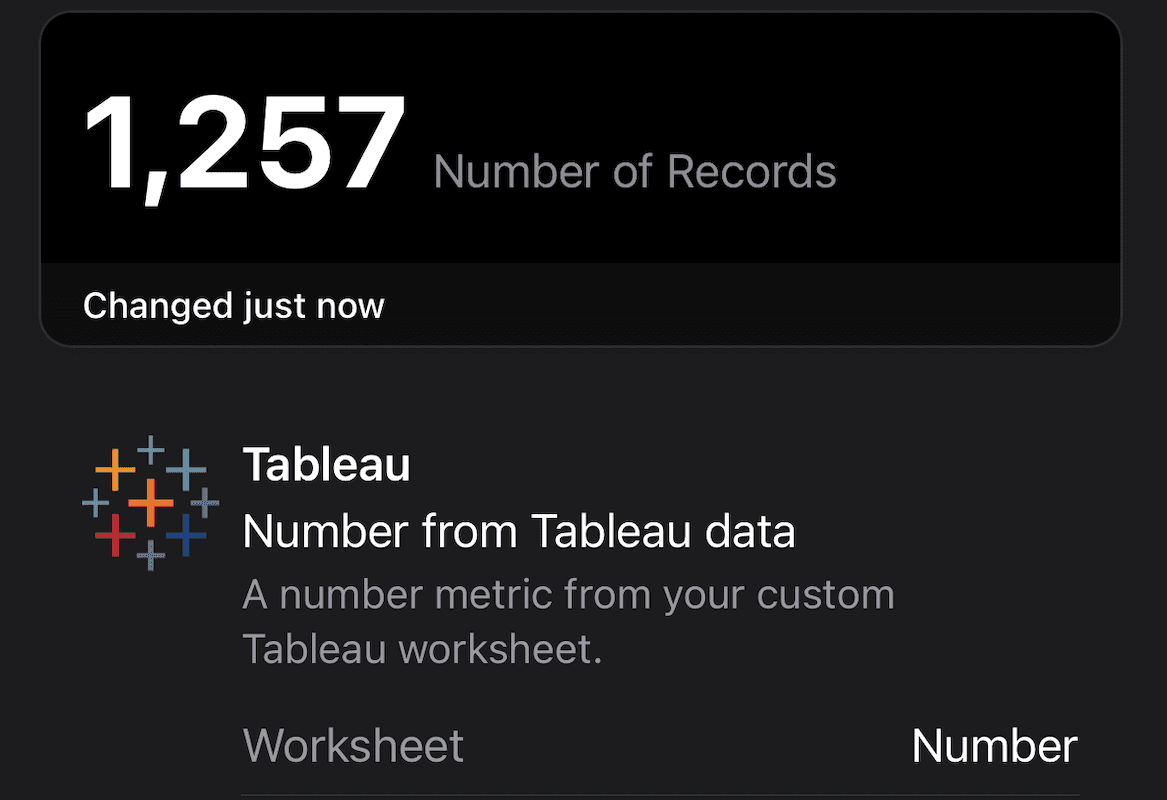
In the widget, choose the saved worksheet to see the number value along with its postfix.
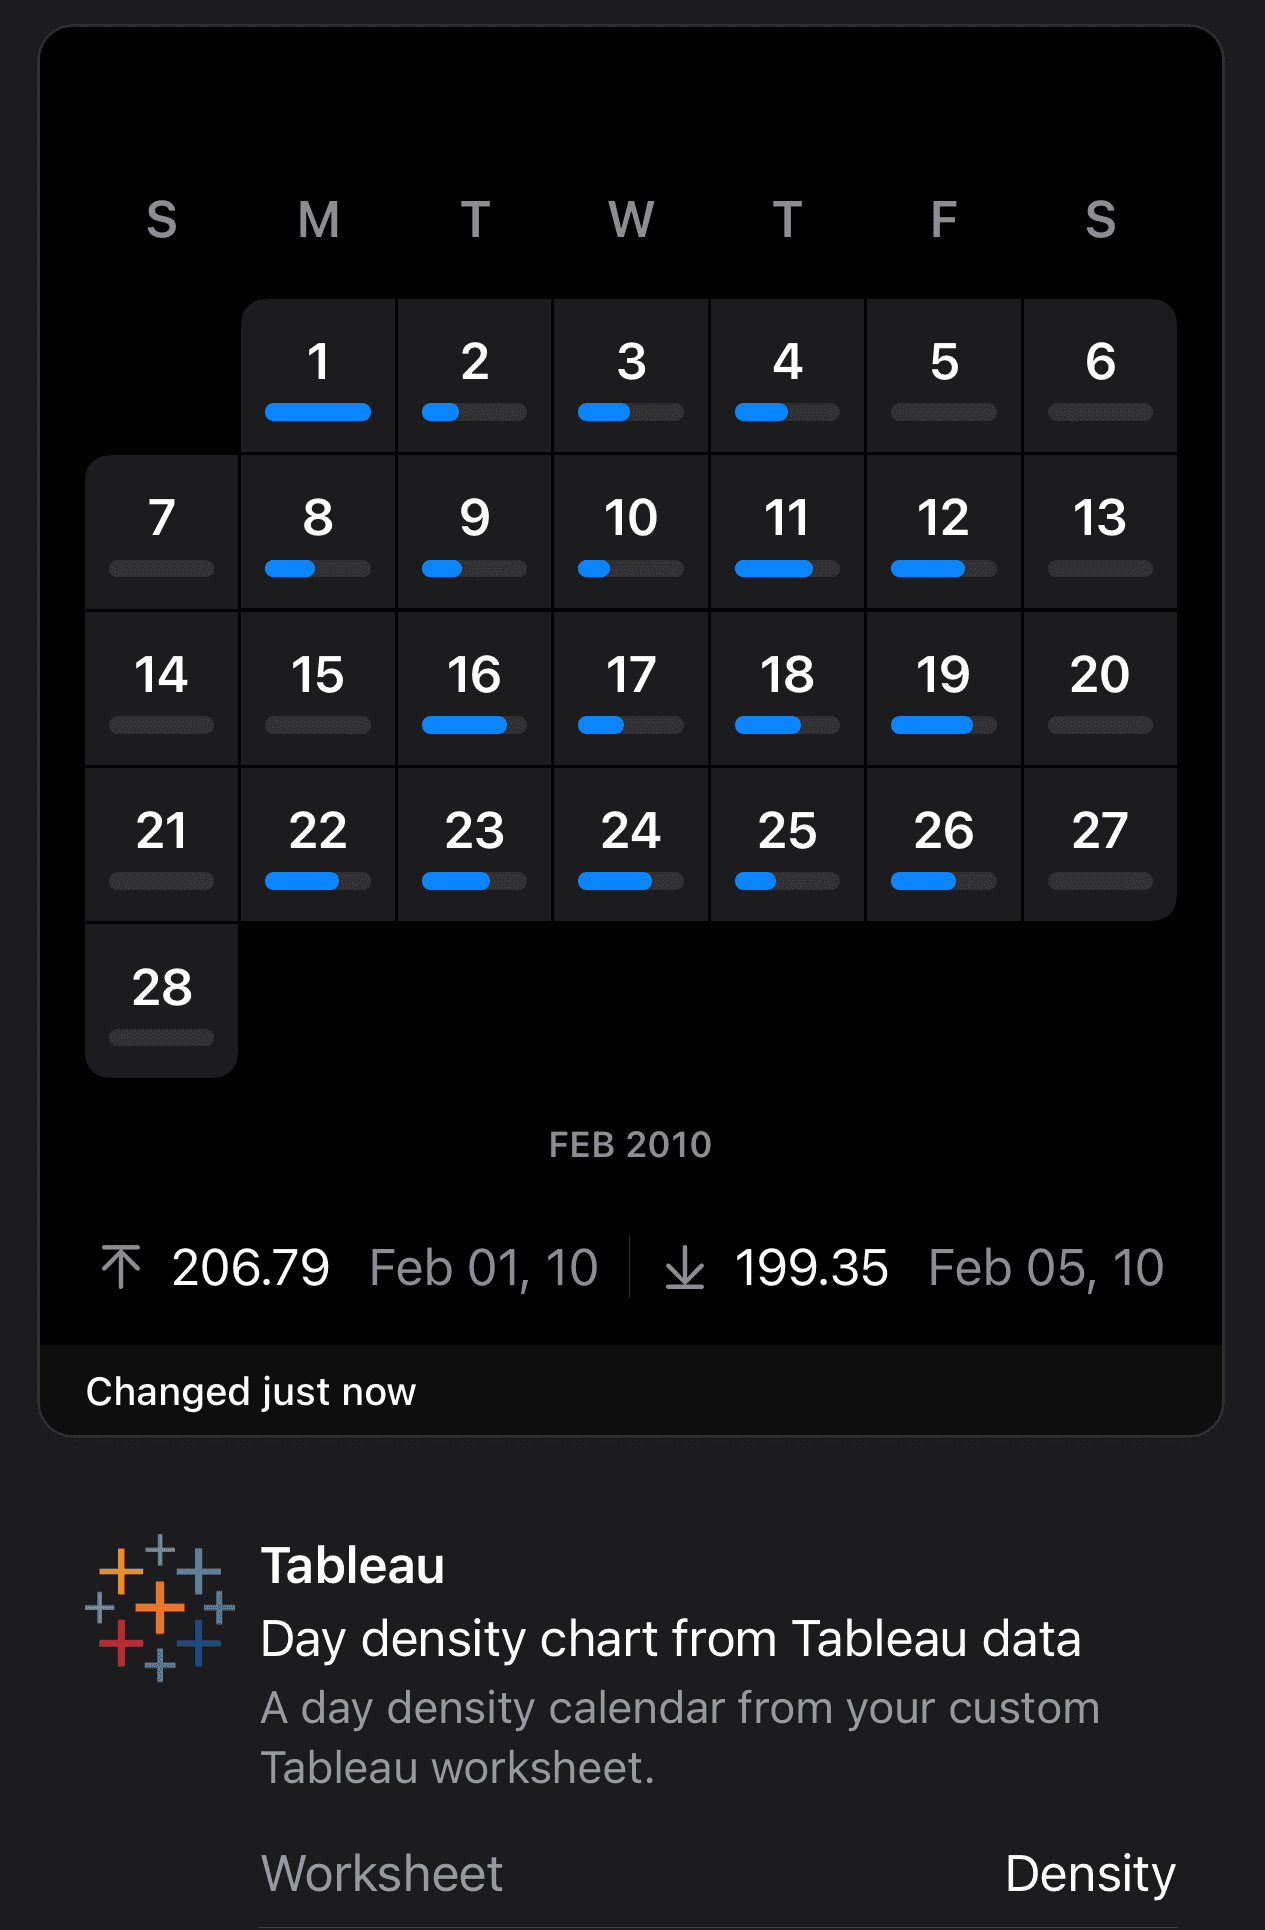
Day Density Chart from Tableau data
For a day density widget, drag a Measure and a Dimension as a date to the Rows/Columns section. Format the date by selecting ‘M/D/YY’ option.
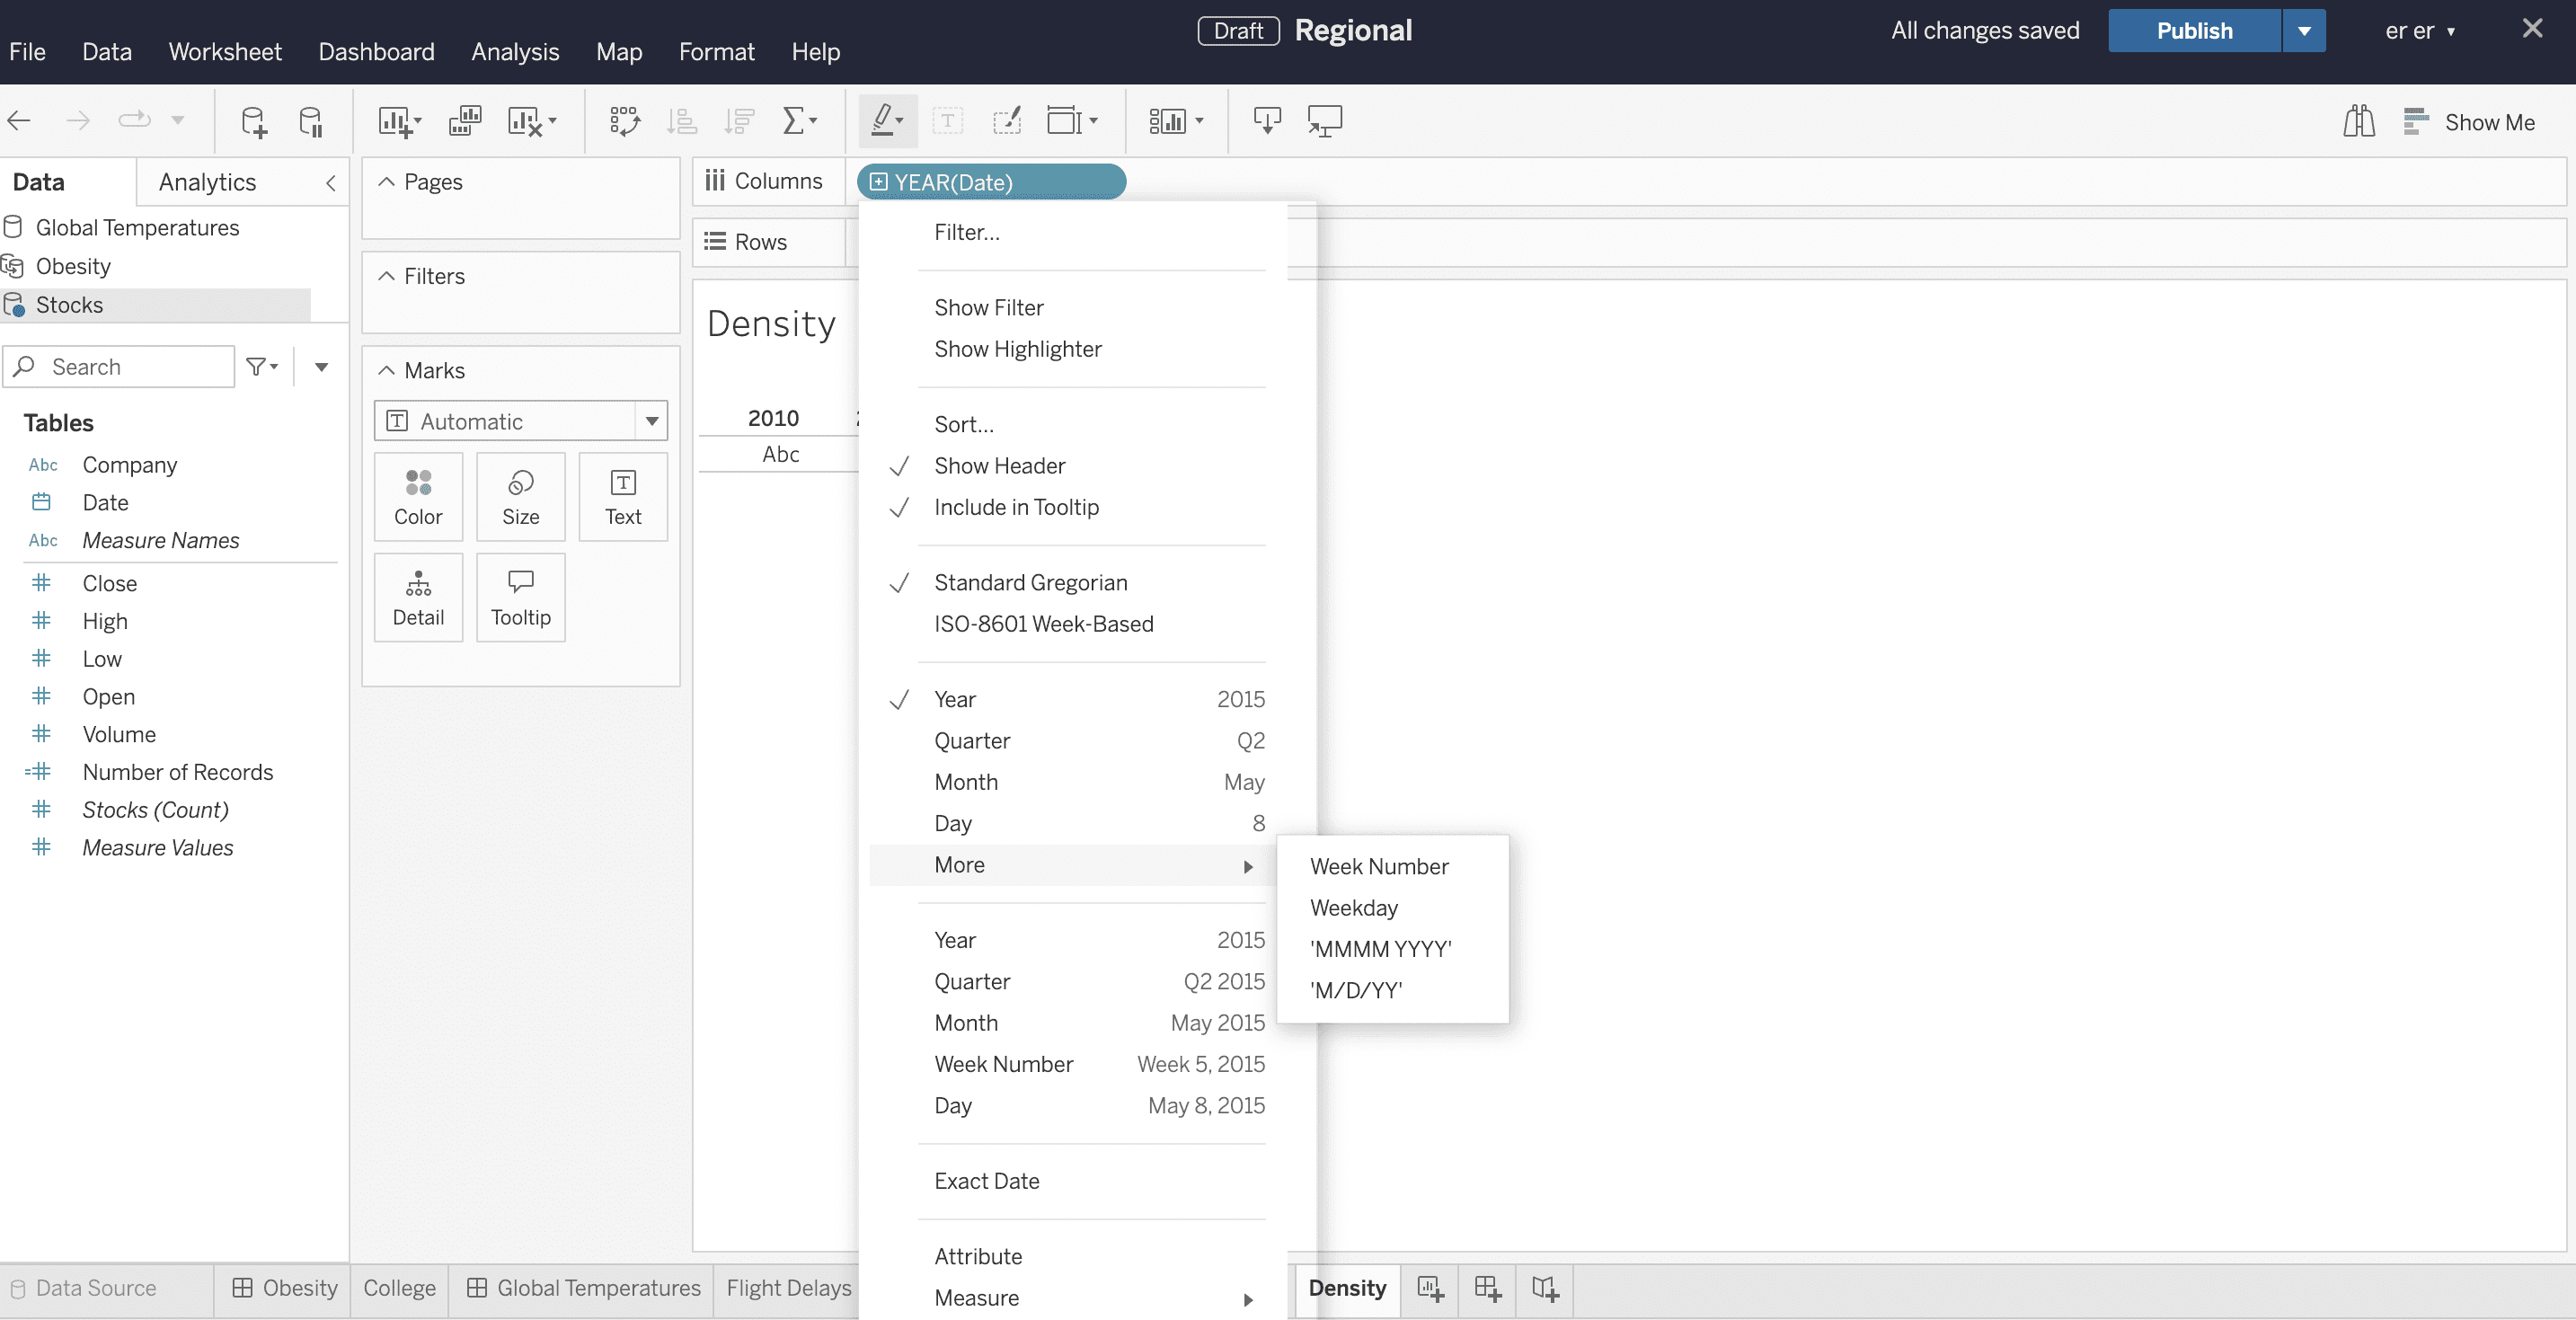
Limit it by choosing the date range of your preferred month. The sheet will automatically show the daily values of chosen Measure for the preferred month. Save and publish the worksheet when you are done.
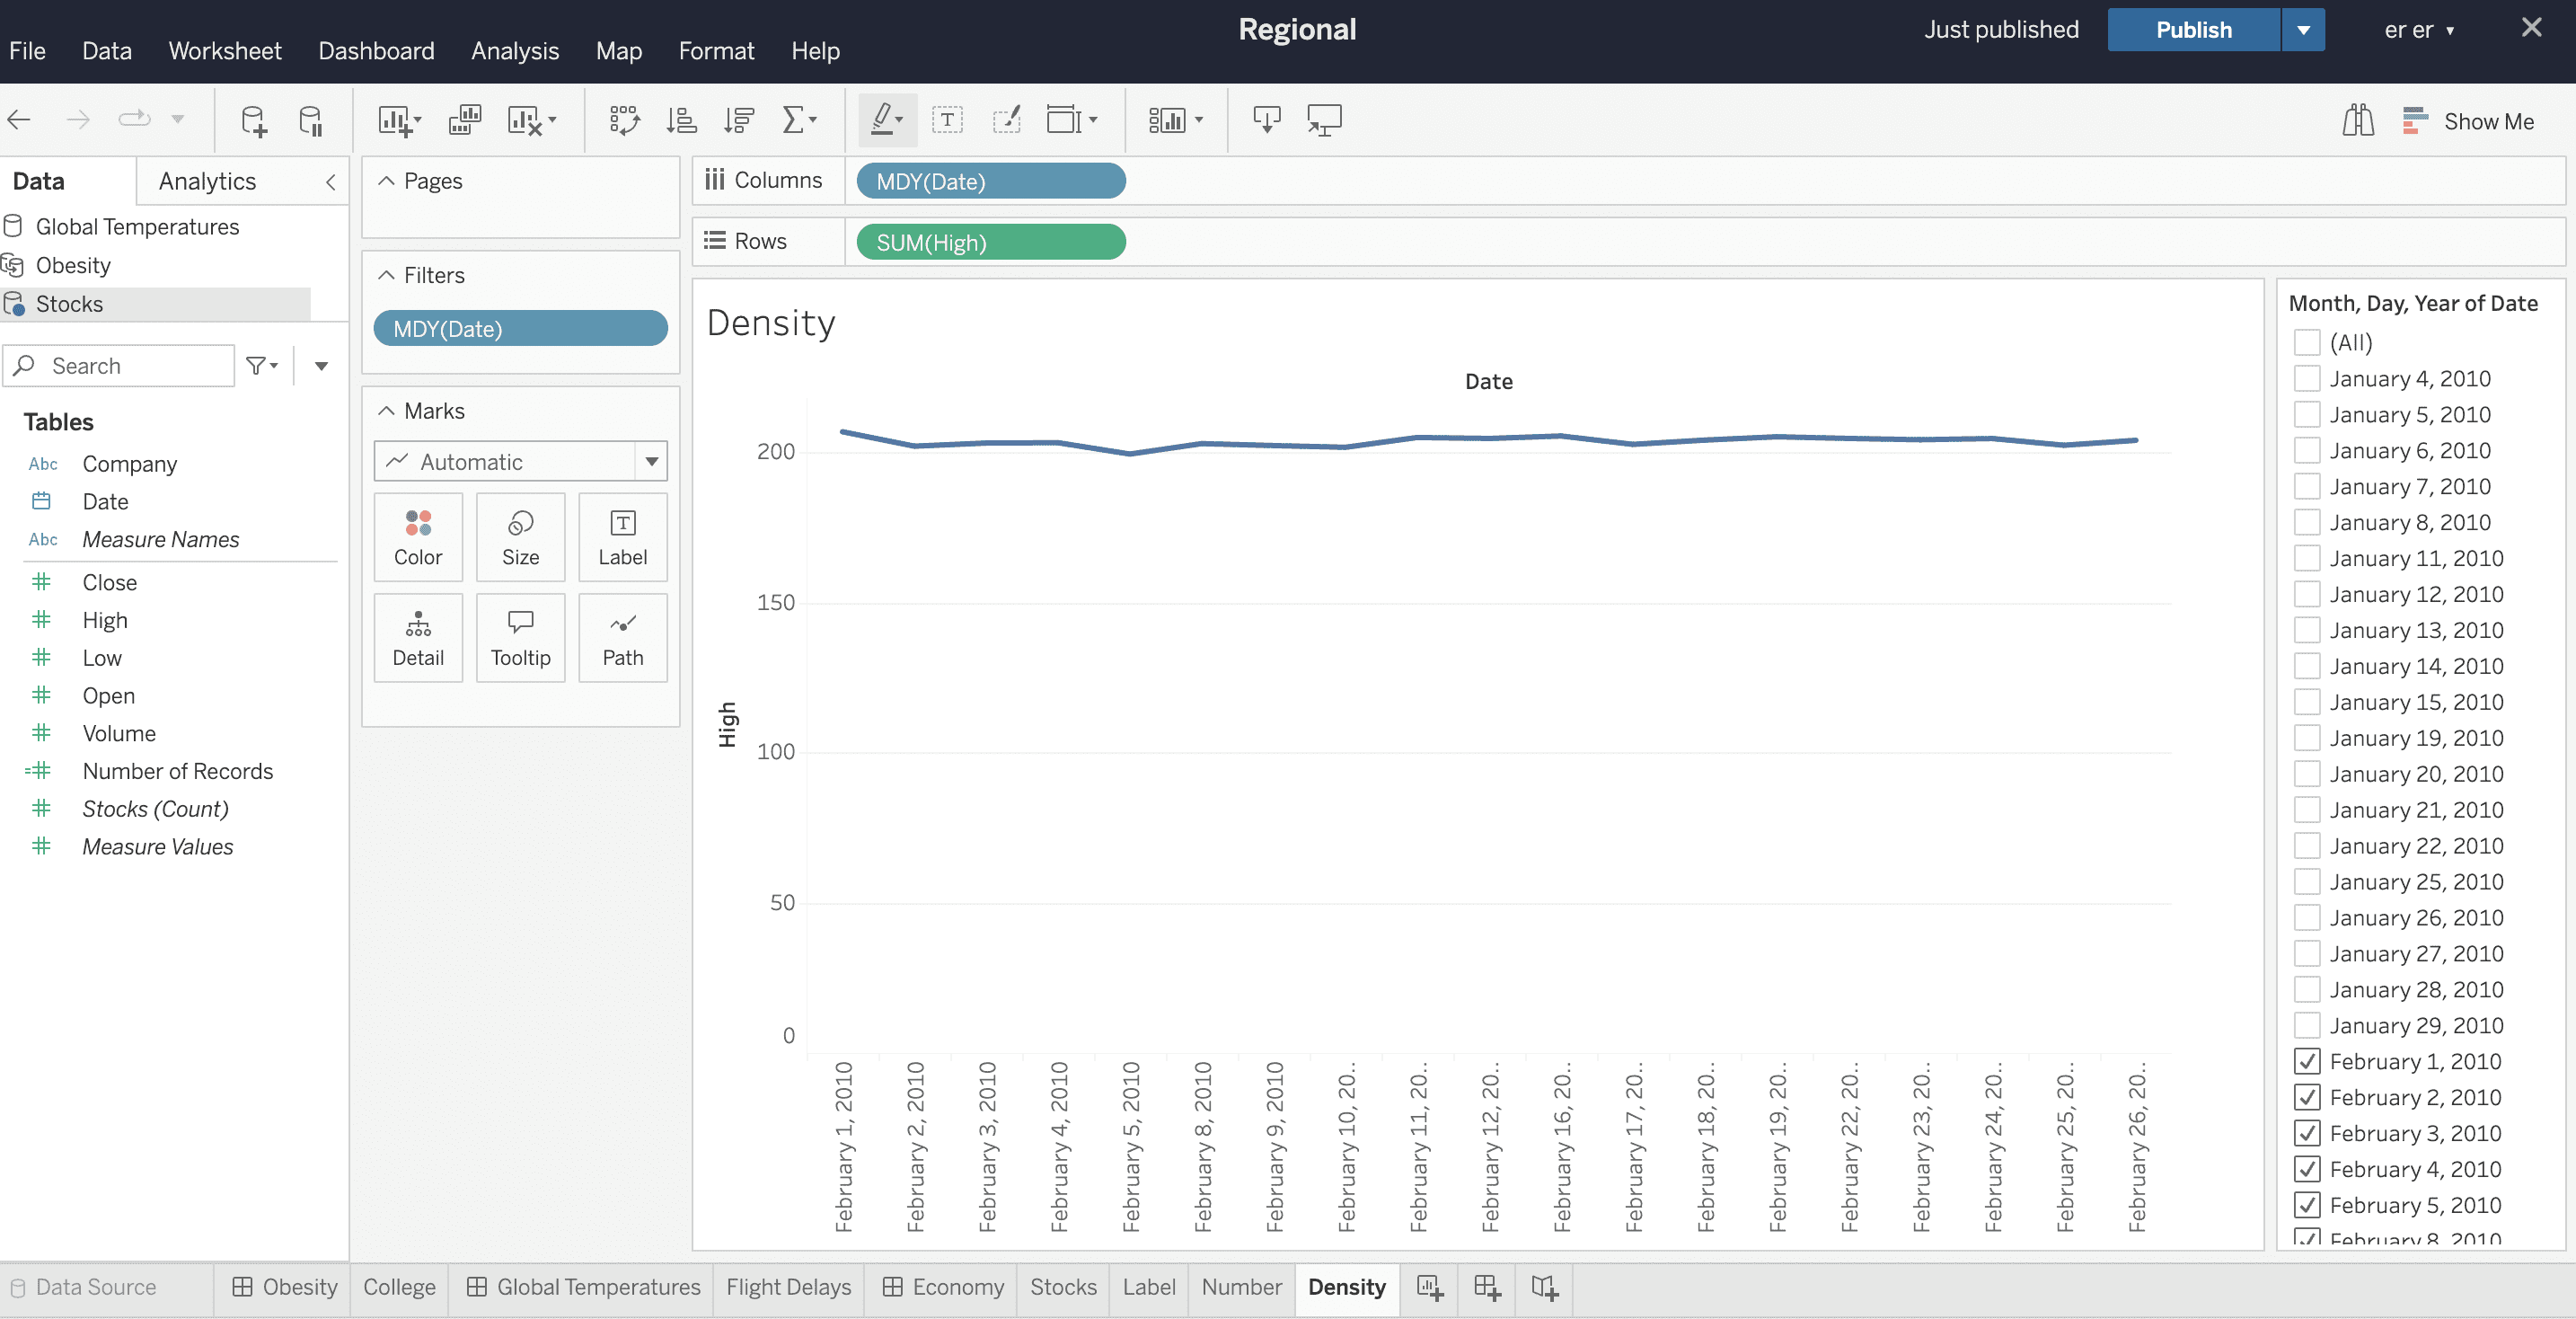
In the widget, choose the saved worksheet to see the day density values for the preferred month and Measure.
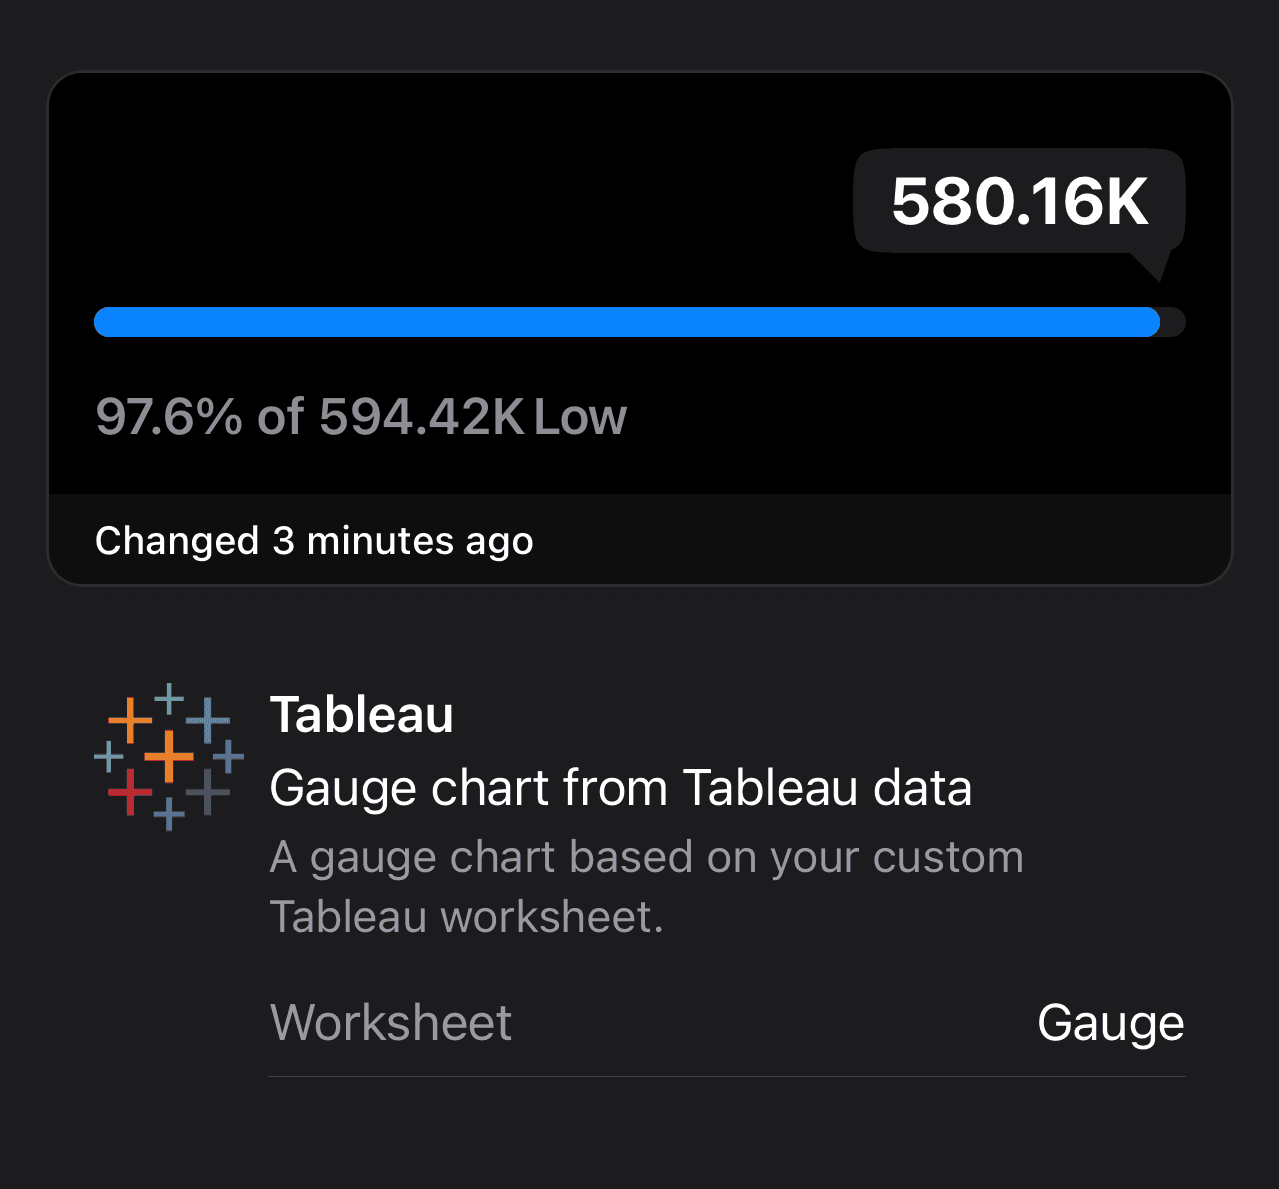
Gauge Chart from Tableau data
For a gauge widget, drag a measure to the Columns section. Drag a second Measure you want to get percentage of, to the Rows section. The sheet will automatically show the values of both Measures. Save and publish this worksheet.
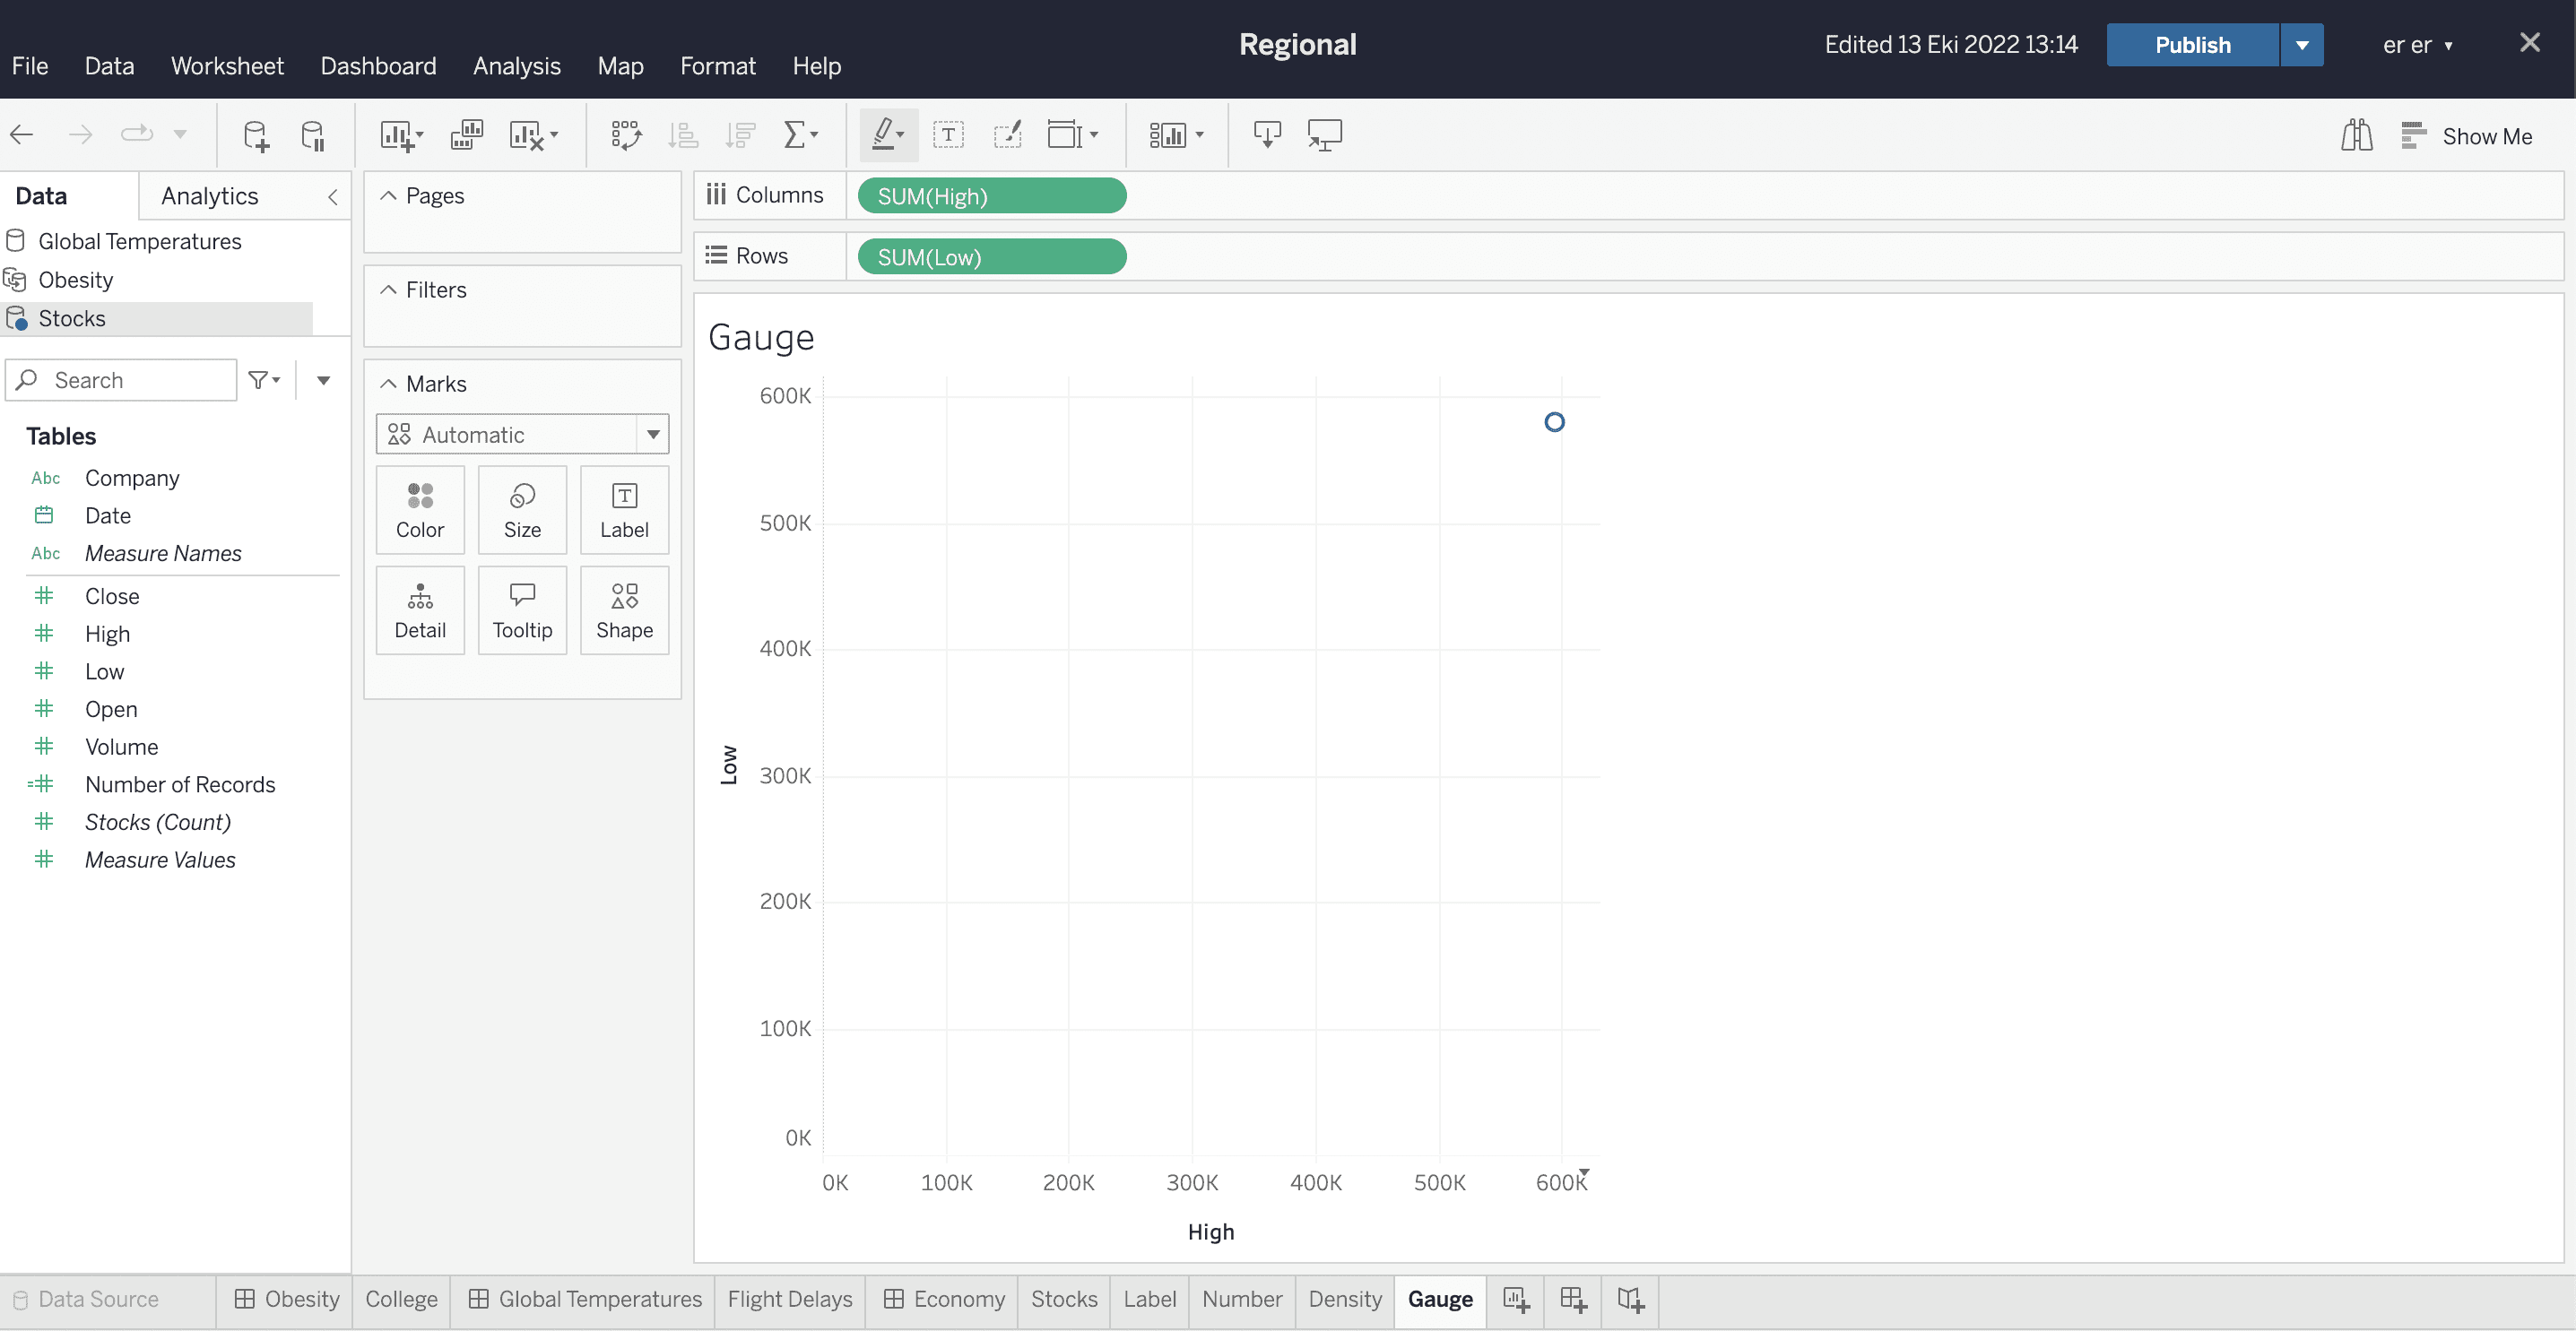
In the widget, choose the saved worksheet to see the comparison of two chosen Measure values in a gauge chart.
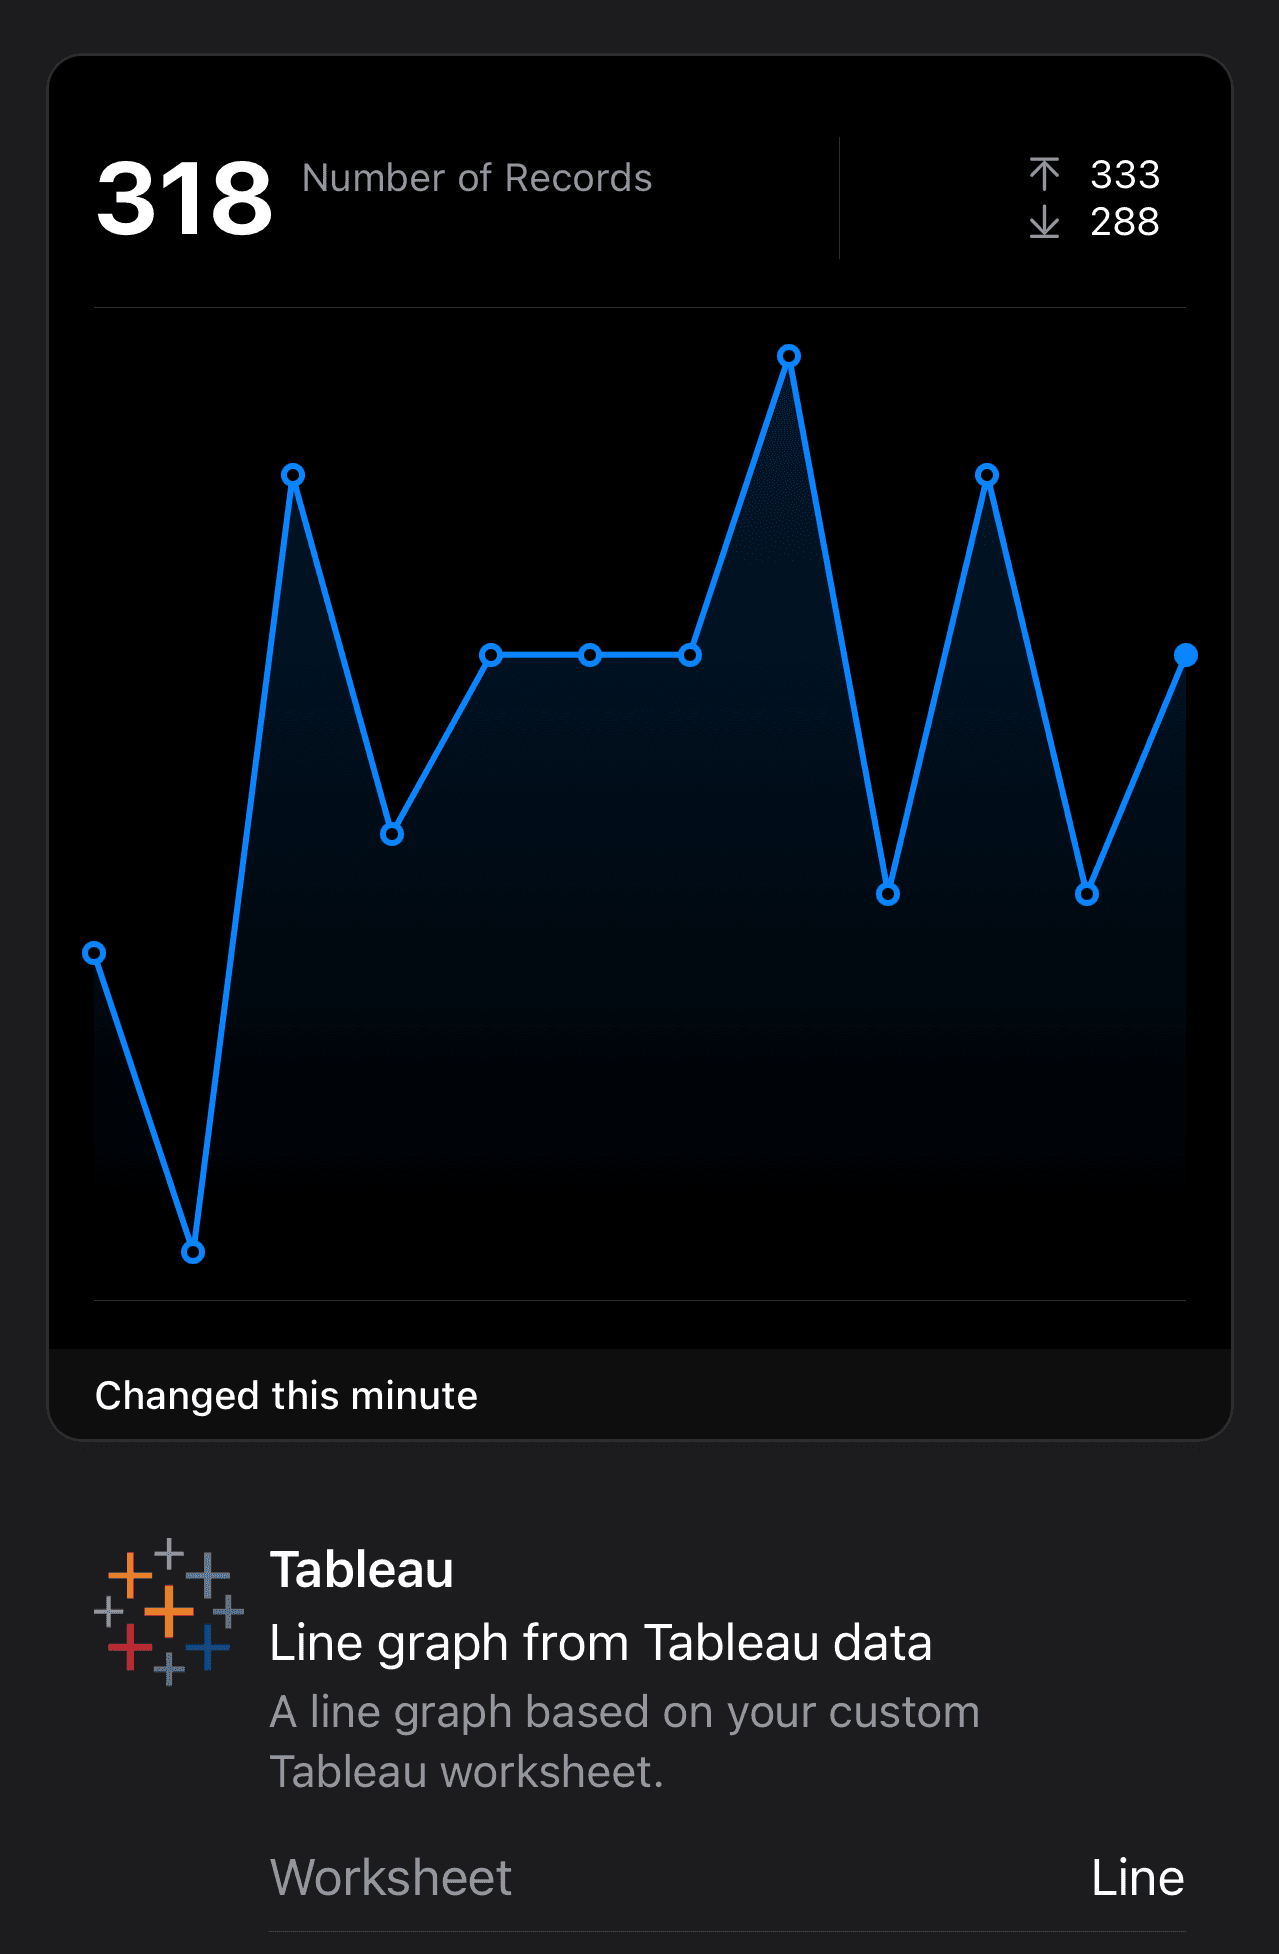
Line Graph from Tableau data
For a line widget, drag a Measure and a Dimension to the Rows/Columns section. The sheet will automatically show the values of chosen Measure for maximum 31 Dimension values. Save and publish this worksheet.
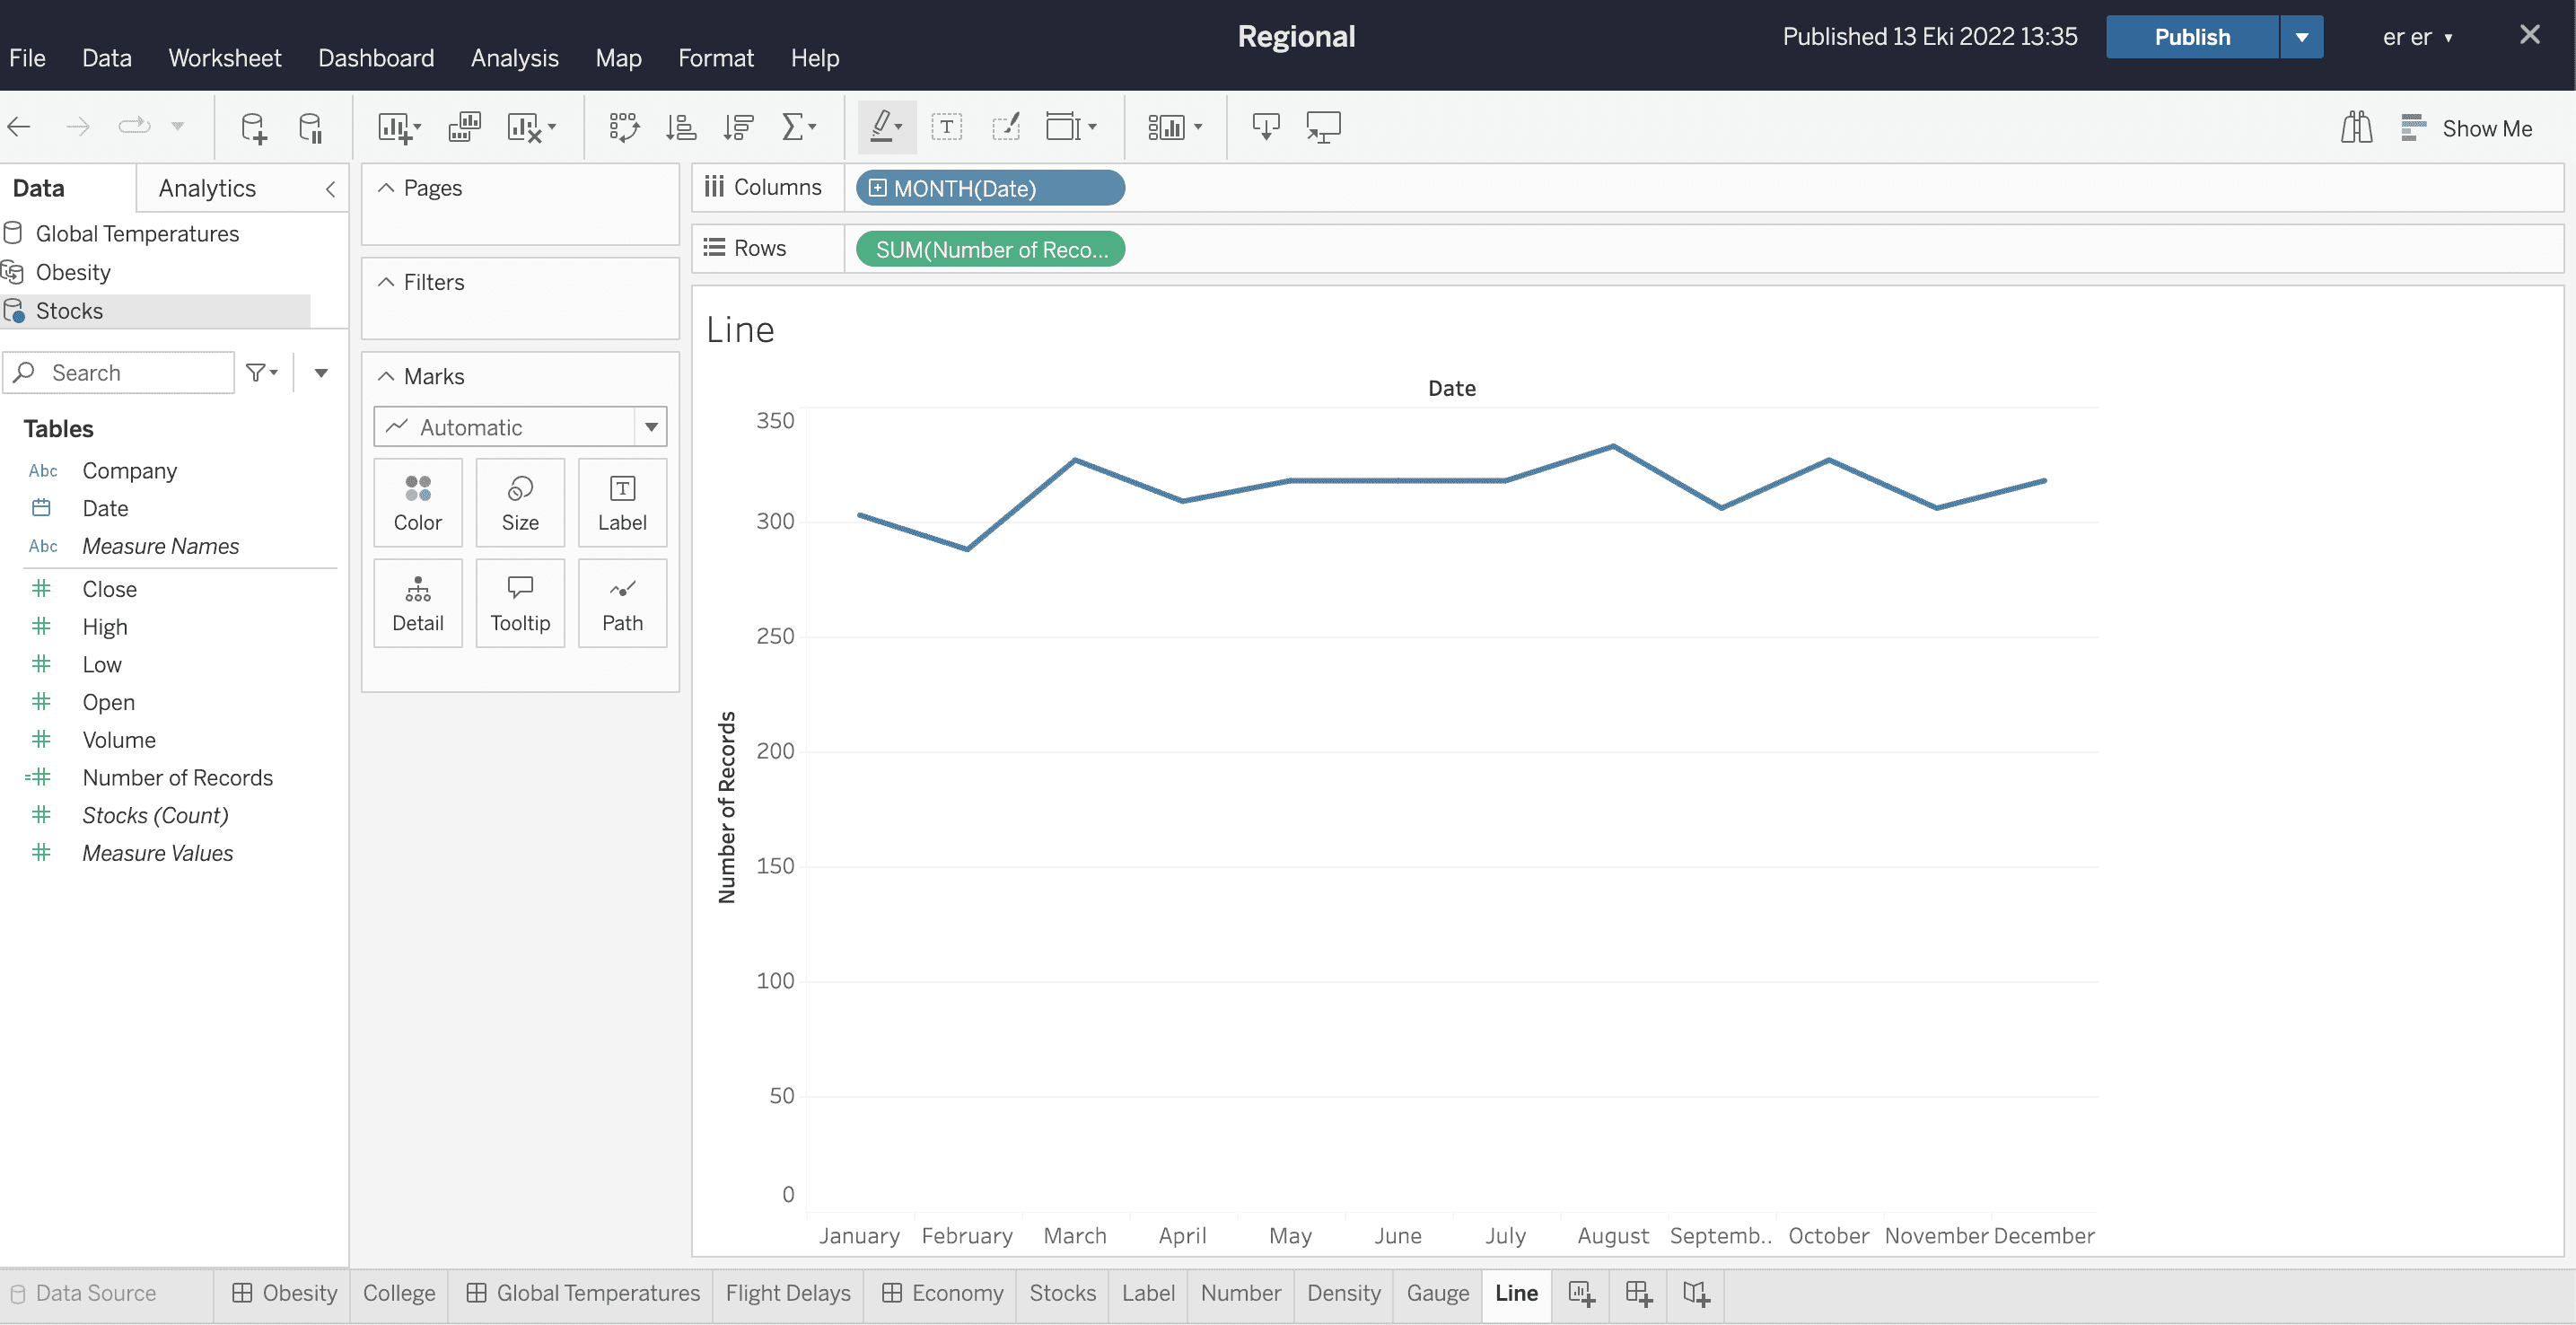
In the widget, choose the saved worksheet to see the line graph of values for the chosen Measure.
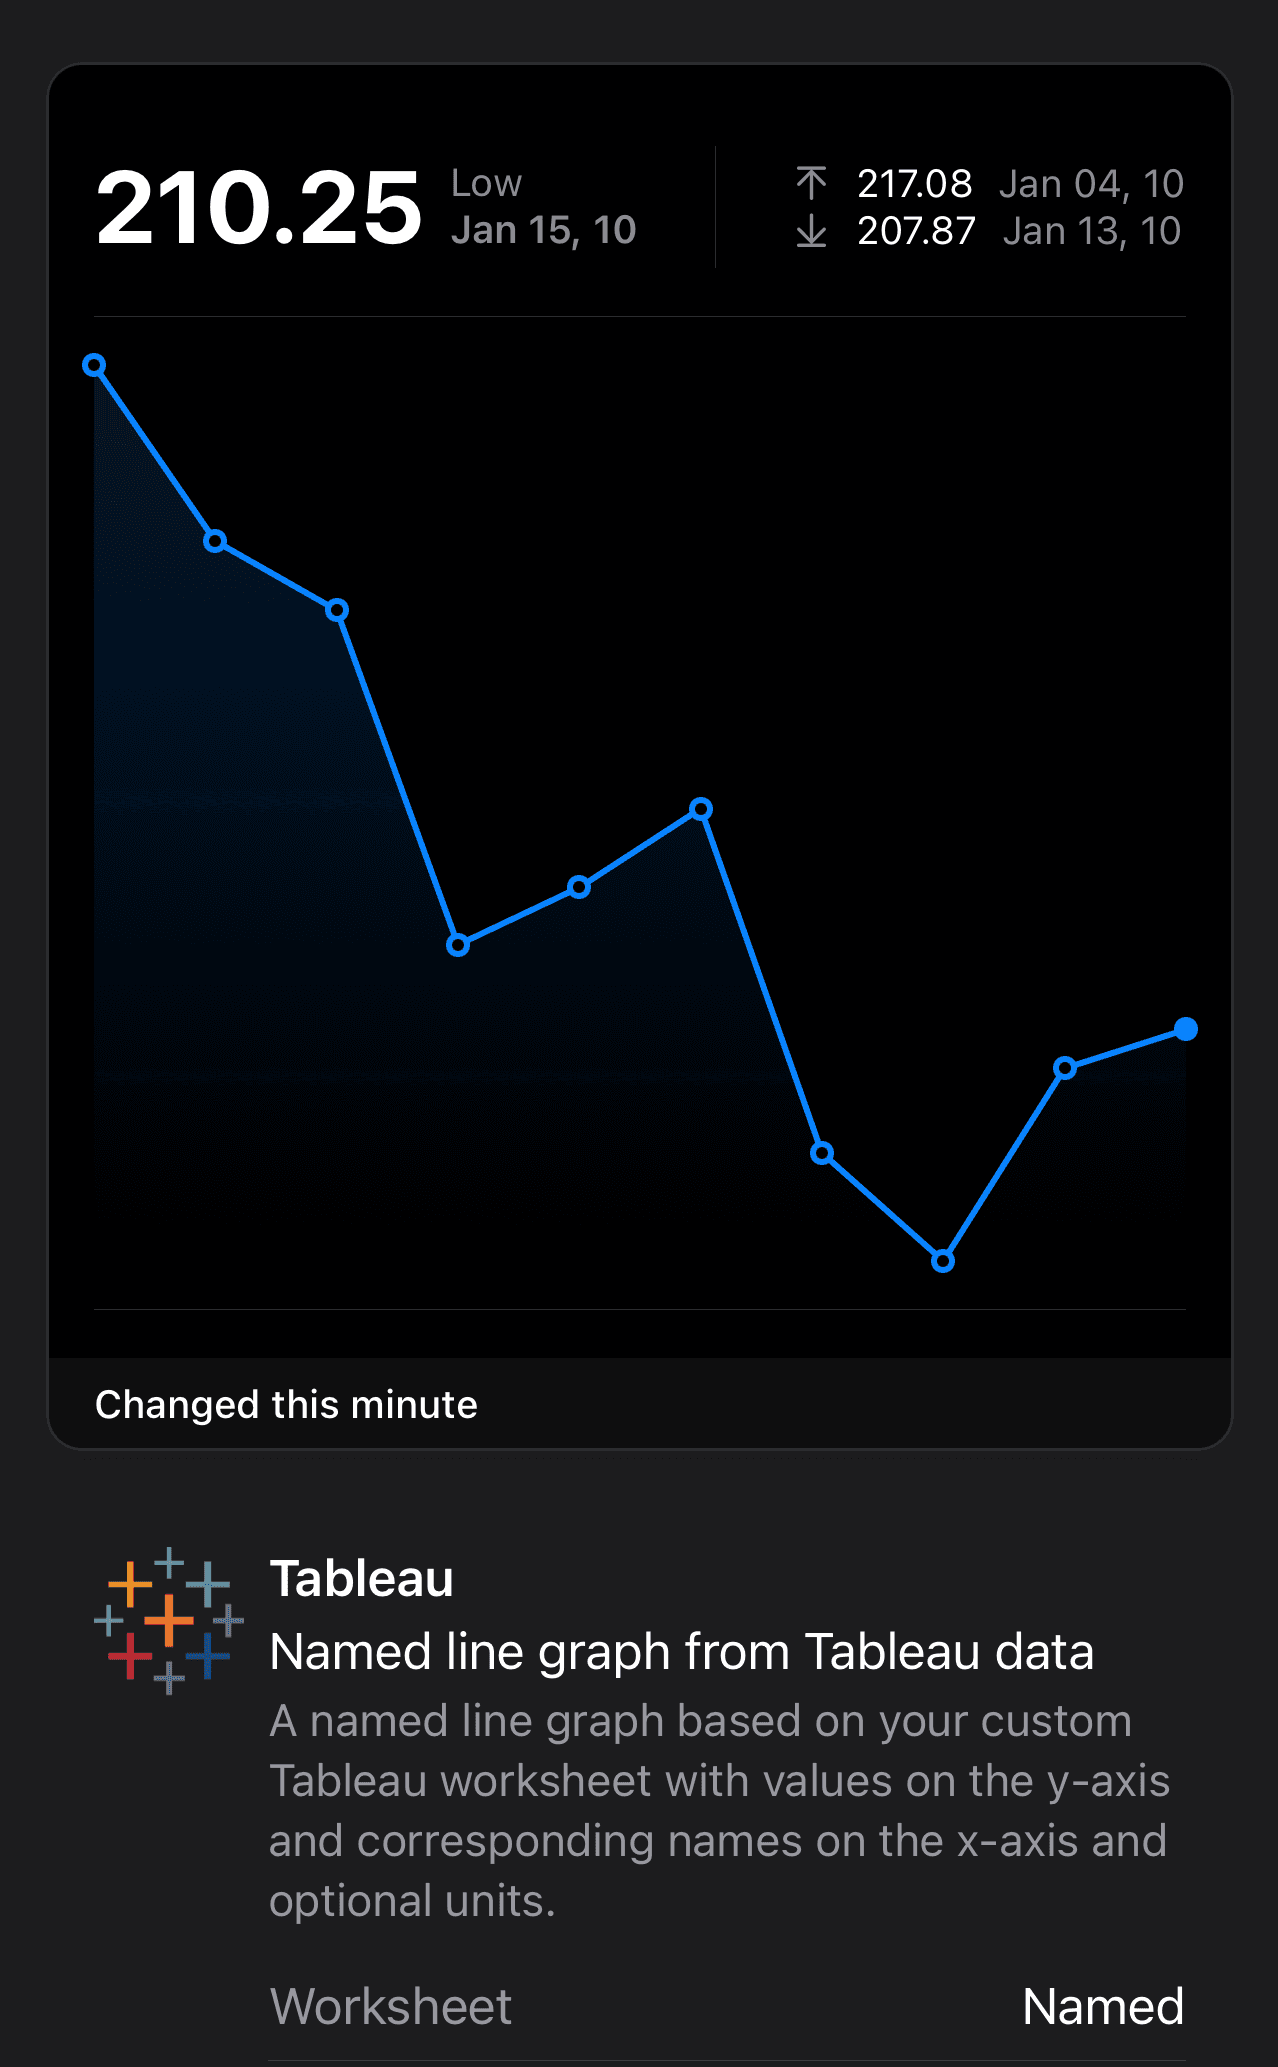
Named Line Graph from Tableau data
For a named line widget, drag a Measure and a Dimension to Rows/Columns section. The sheet will automatically show the values of chosen Measure for maximum 31 Dimension values. If a date is chosen for Dimension, format the date by selecting ‘M/D/YY’ option and limit it by choosing the date range. Save and publish this worksheet.
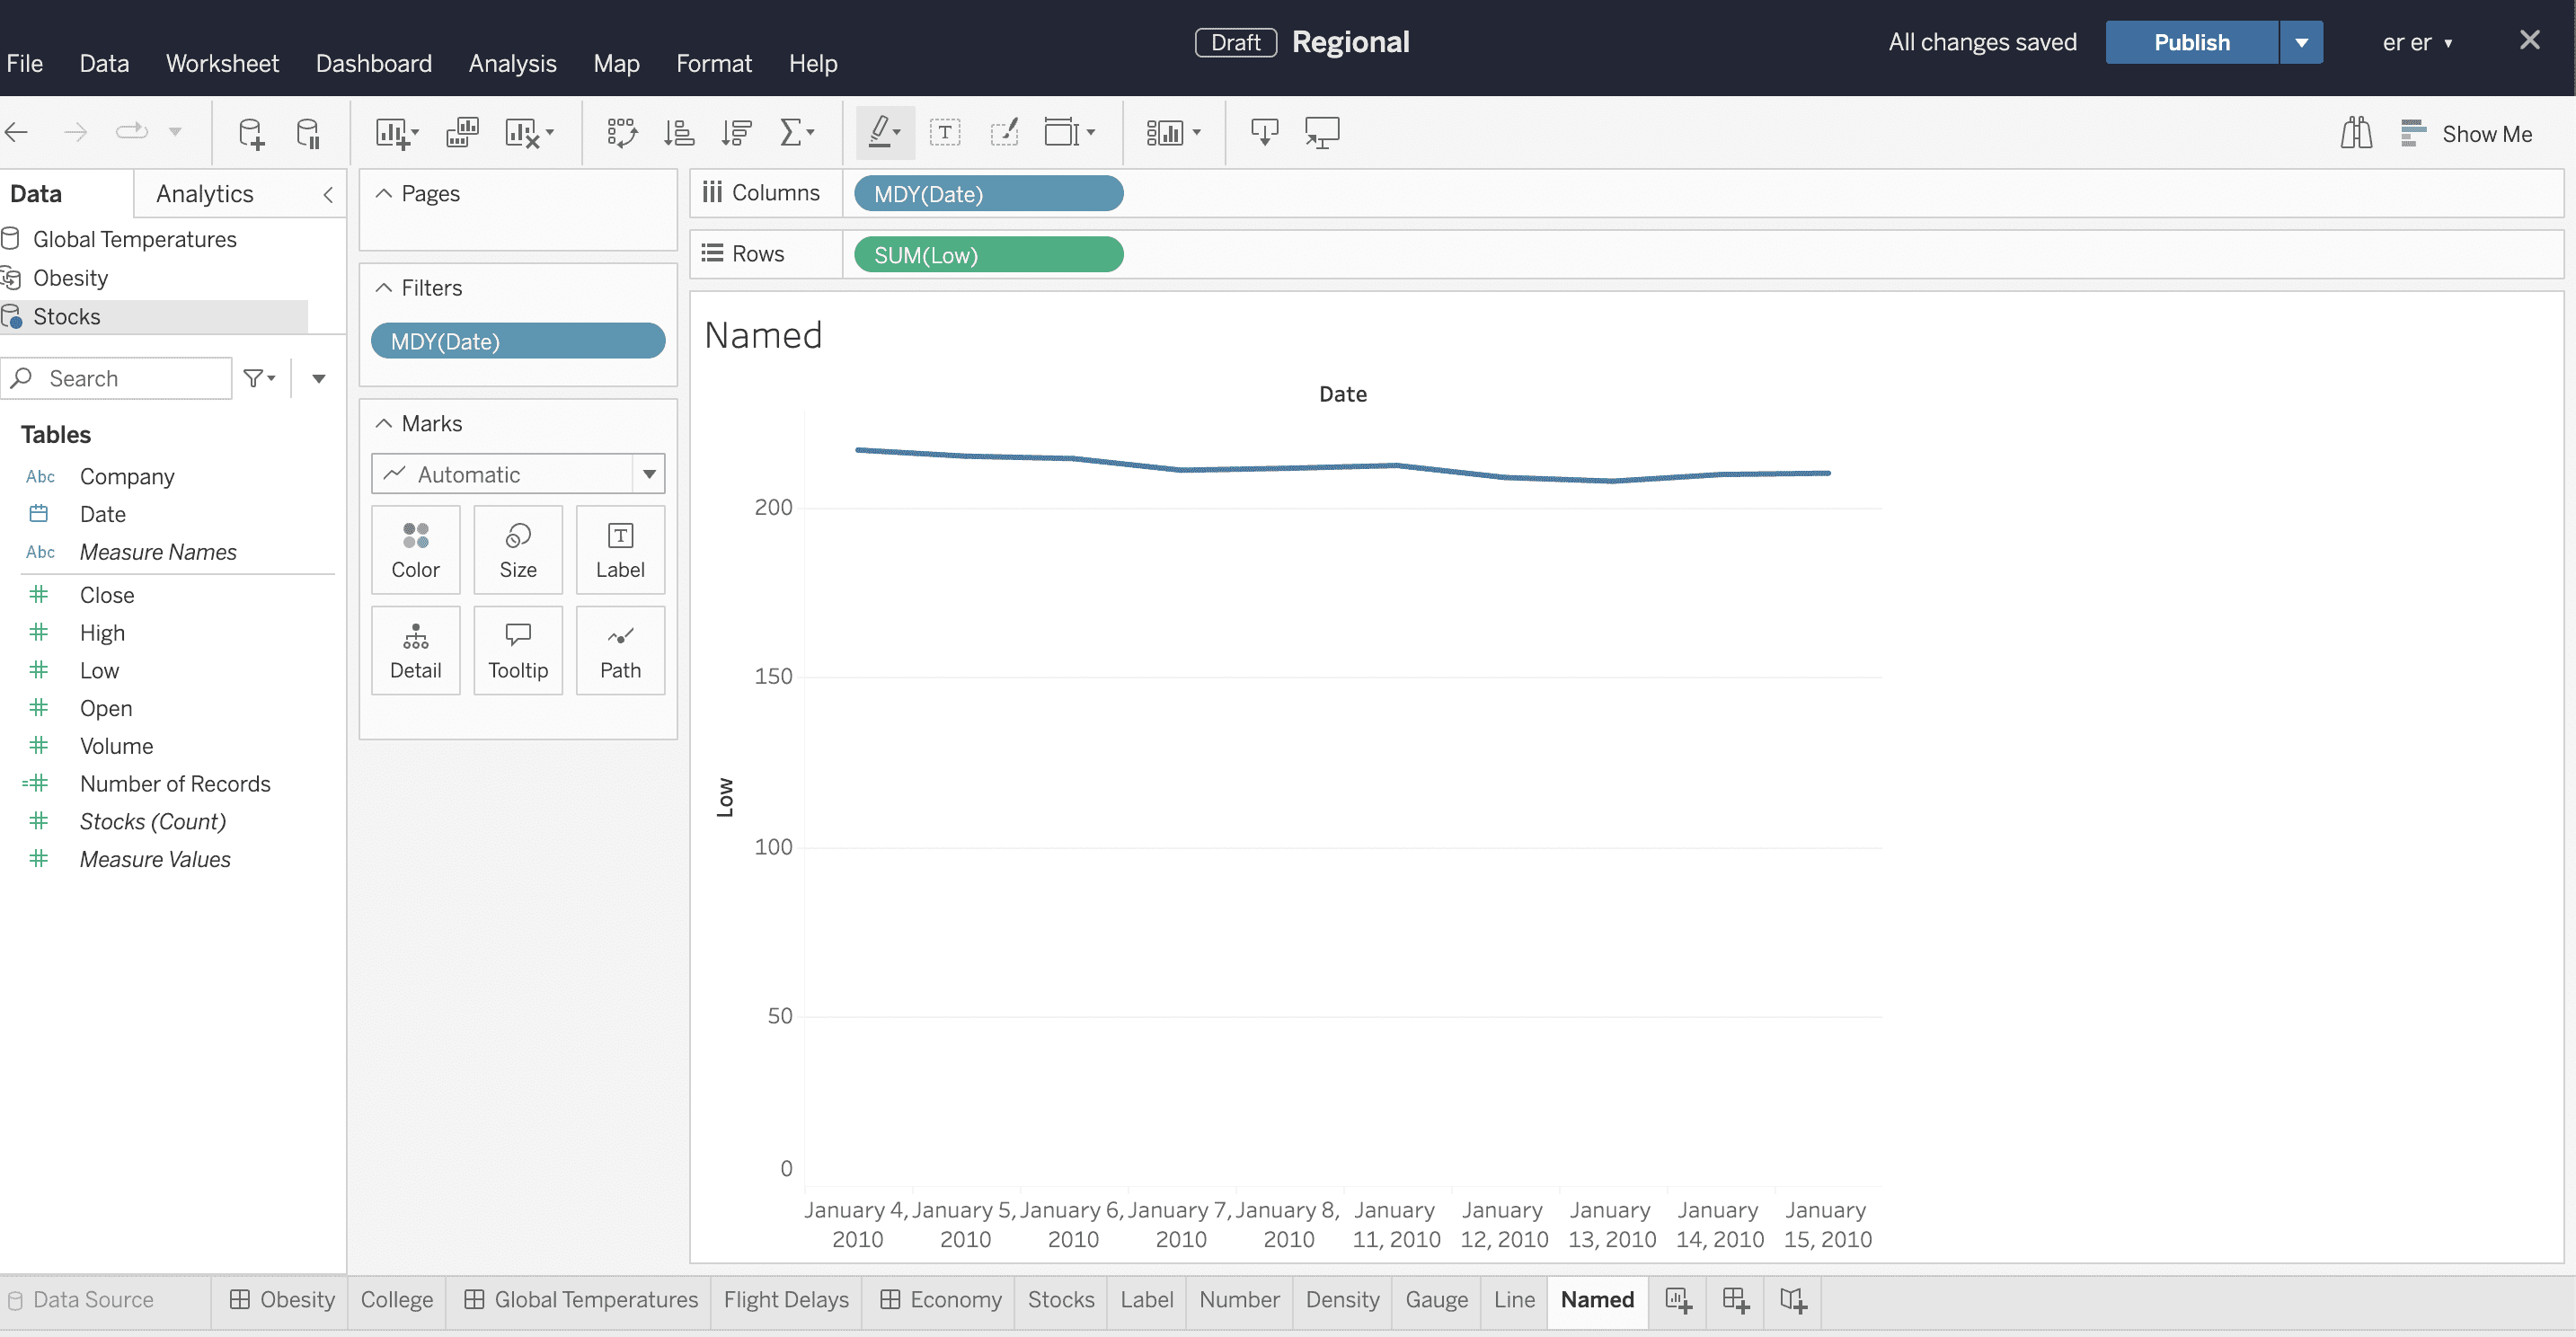
In the widget, choose the saved worksheet to see the named line graph of values for the chosen Measure.
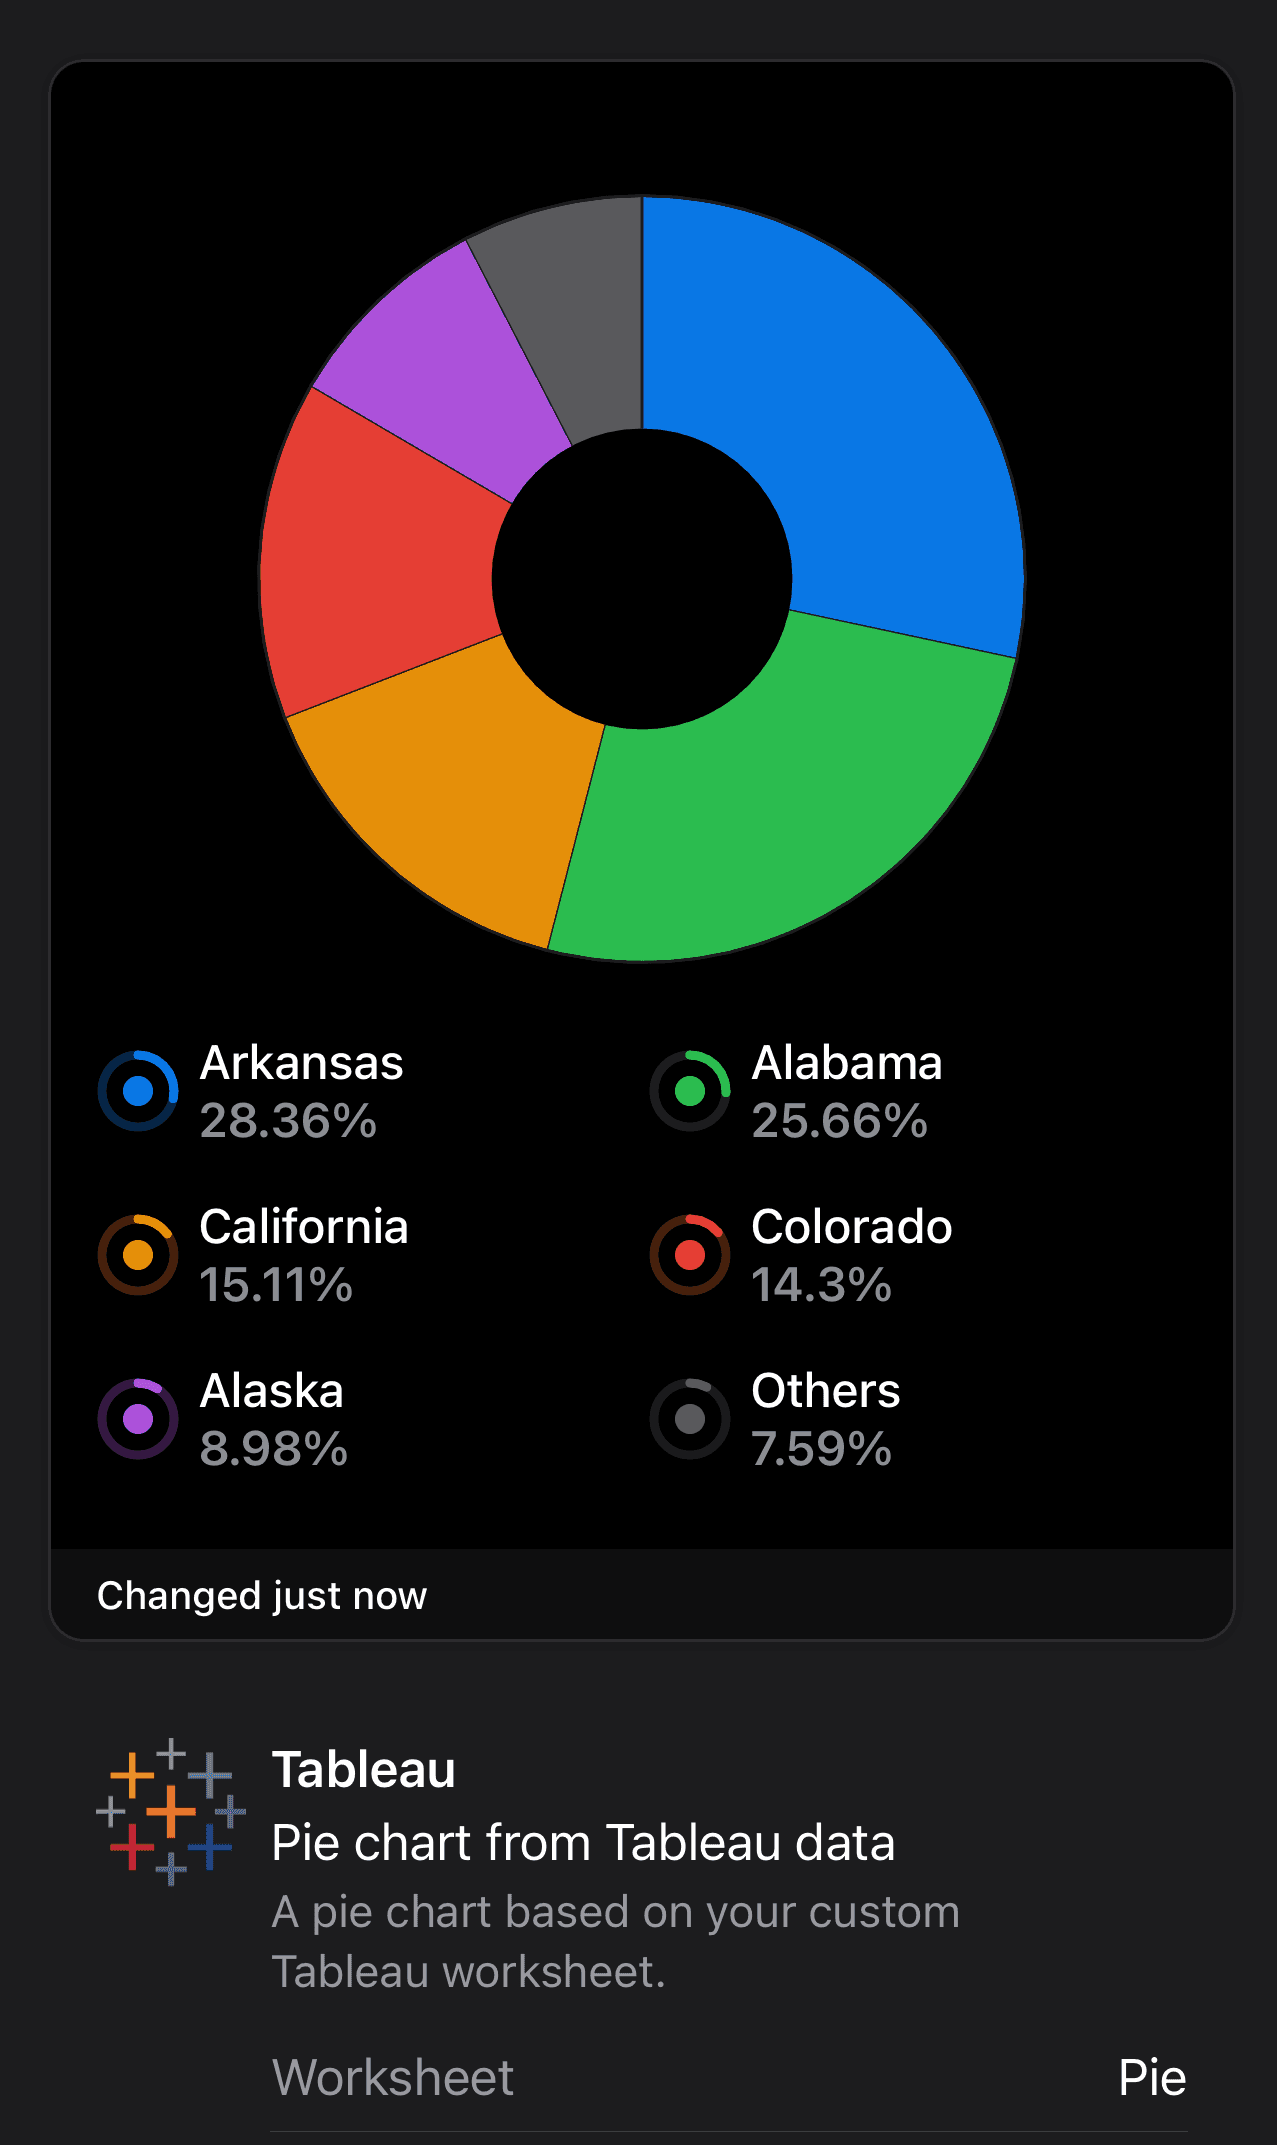
Pie Chart from Tableau data
For a pie widget, drag a Measure and a Dimension to the Rows/Columns section. The sheet will automatically show the values of chosen Measure for each Dimension. Save and publish this worksheet.
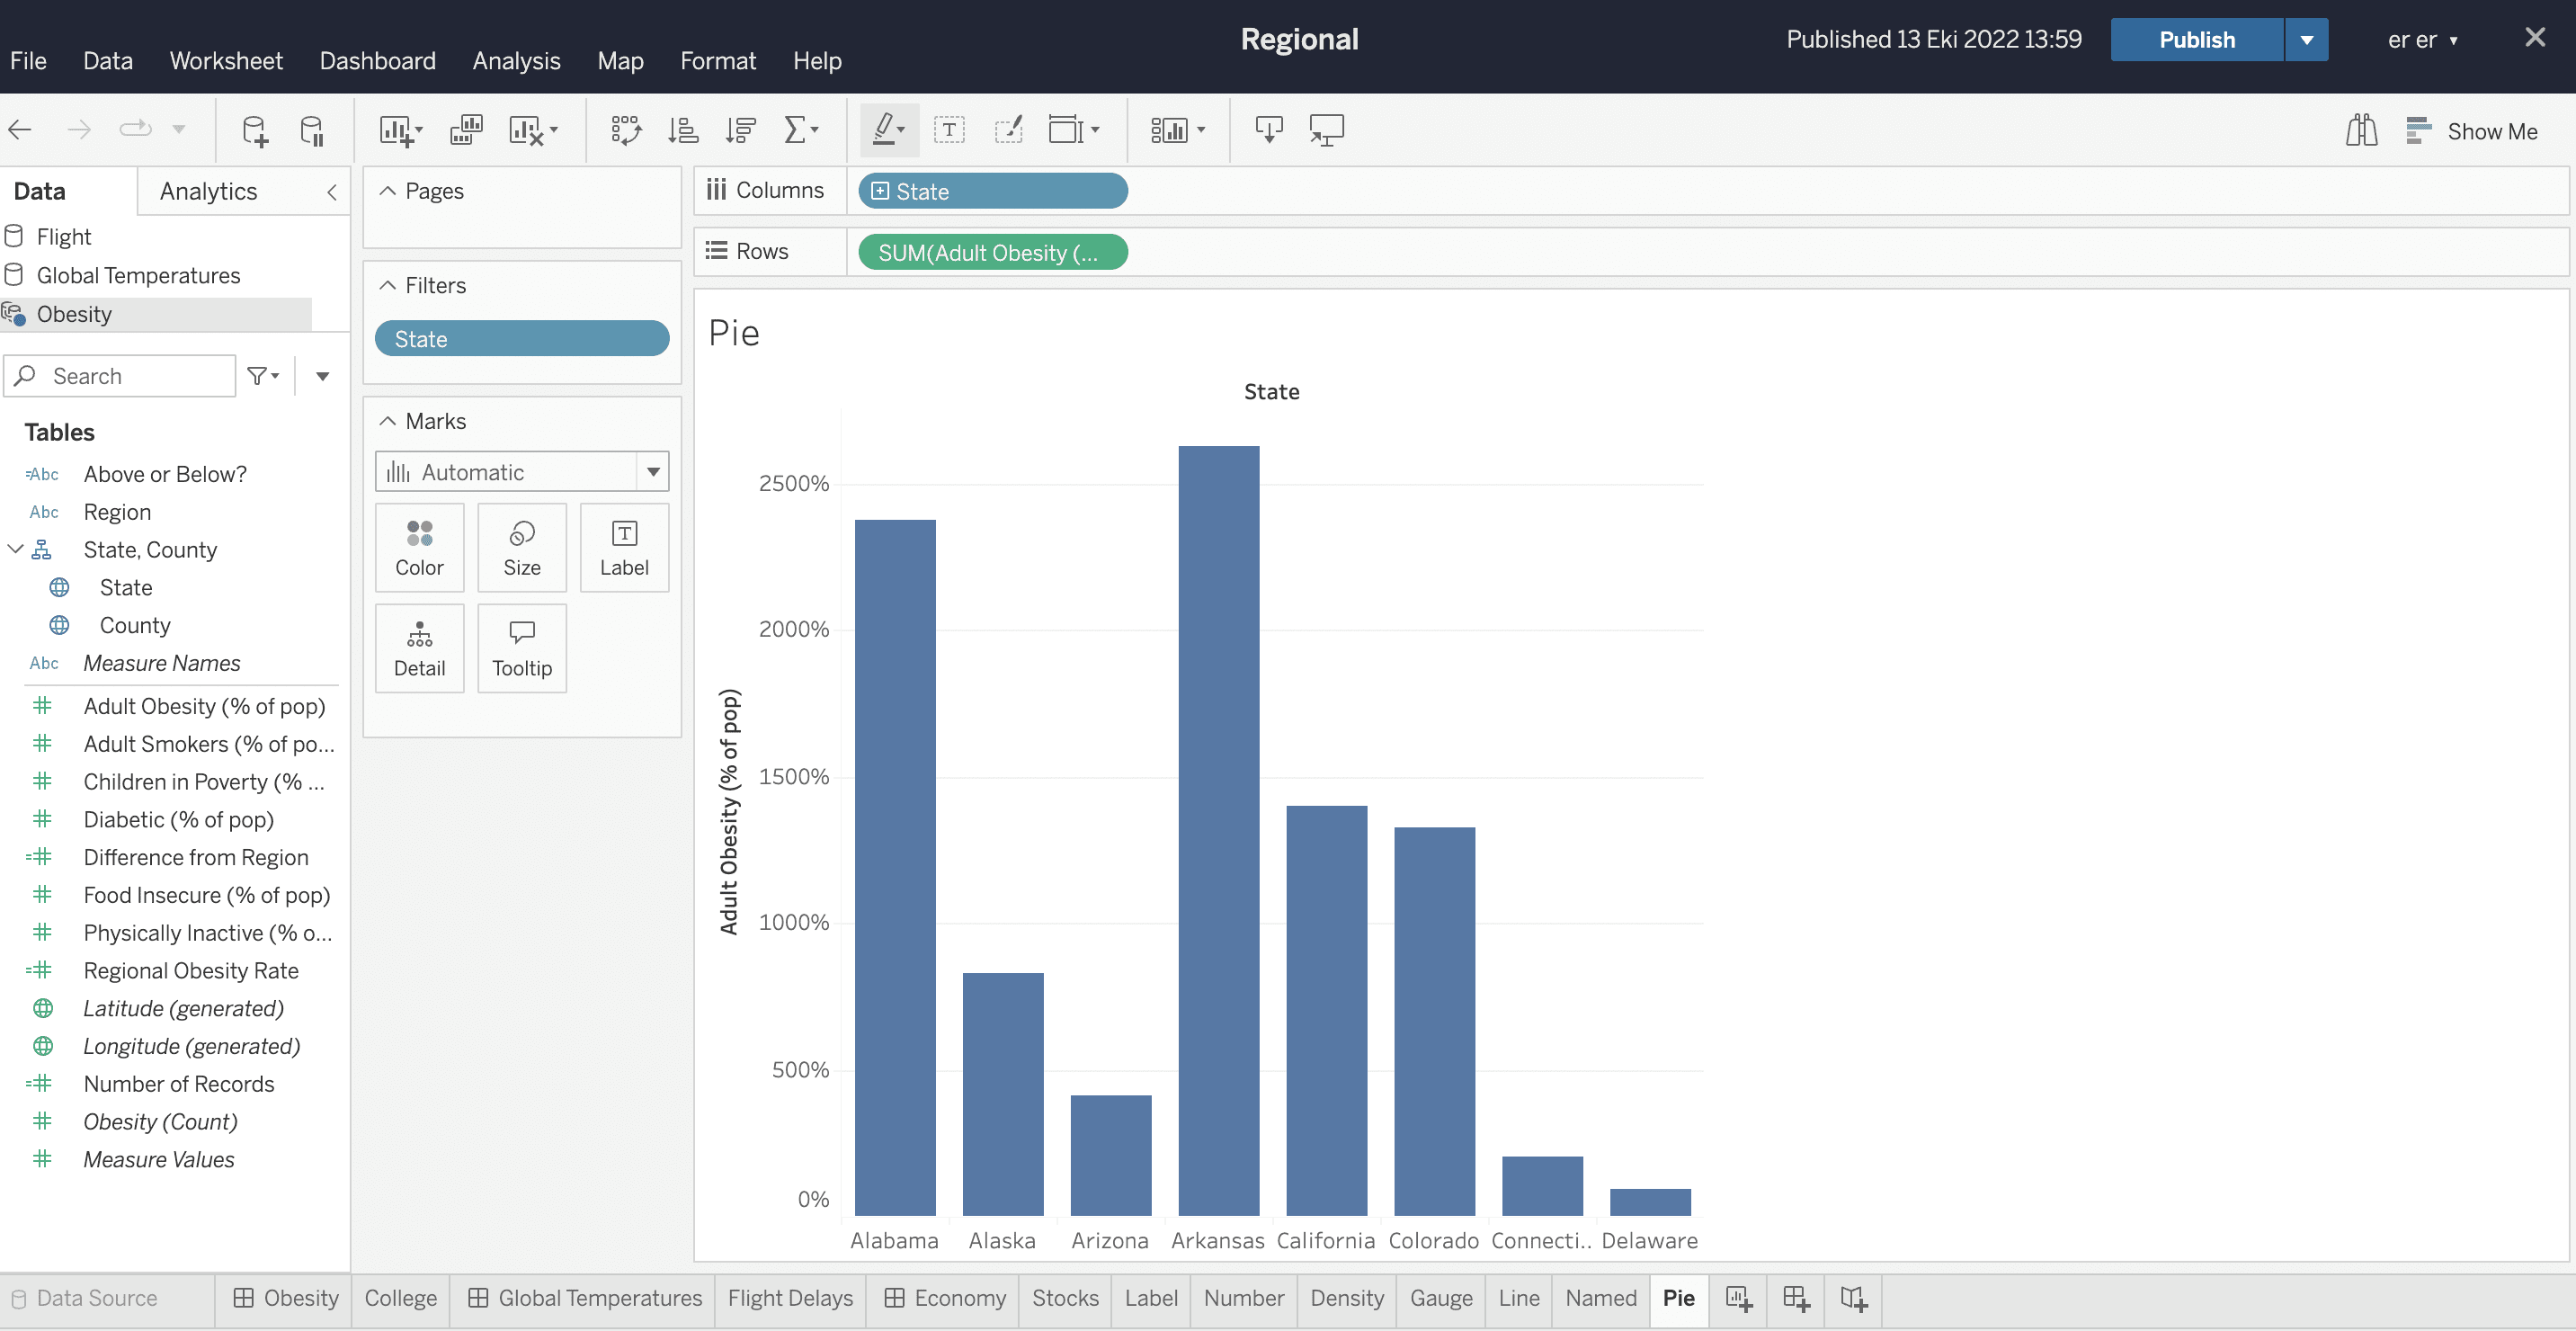
In the widget, choose the saved worksheet to see the pie chart of values for the chosen Measure along with Dimension names as postfixes.
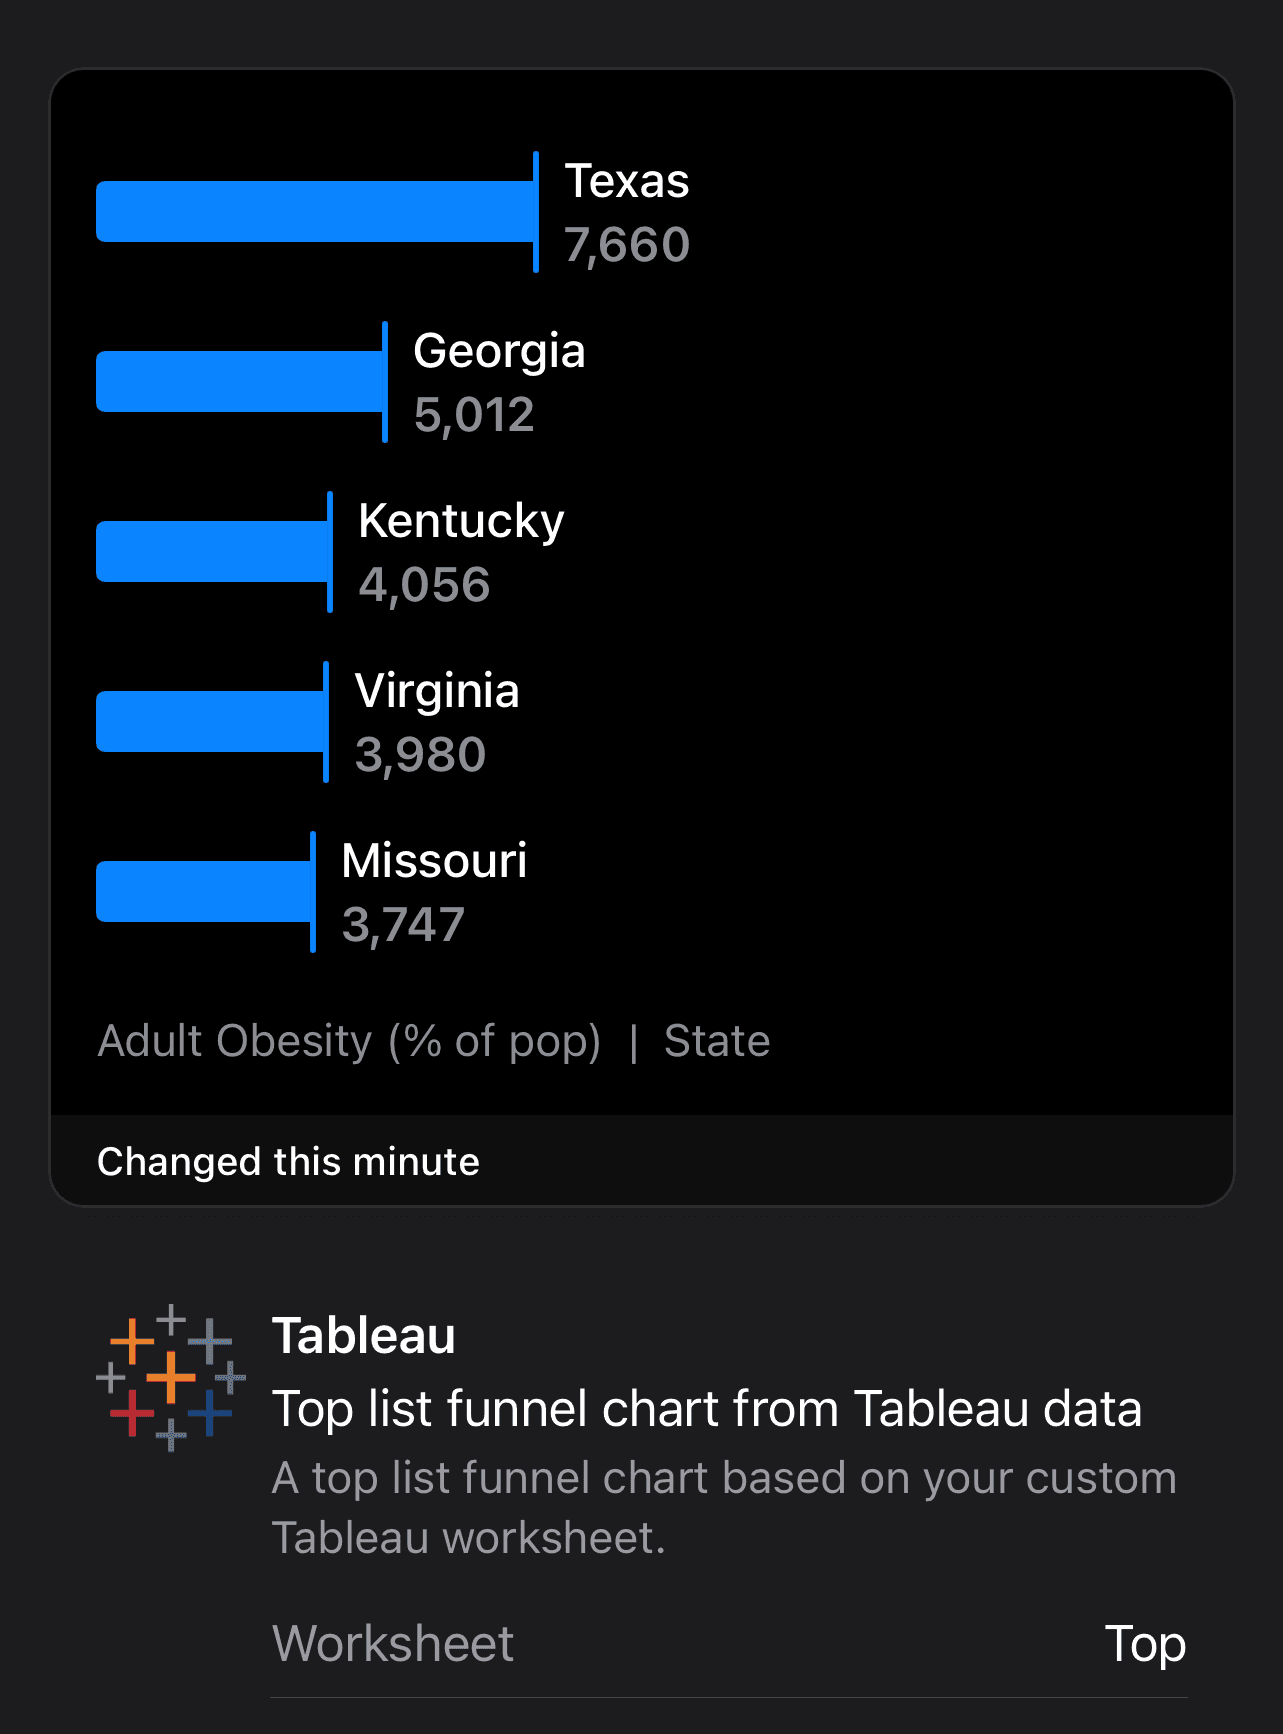
Top List Funnel Chart from Tableau data
For a top list widget, drag a Measure and a Dimension to the Rows/Columns section. The sheet will automatically show the values of chosen Measure for each Dimension. Save and publish this worksheet.
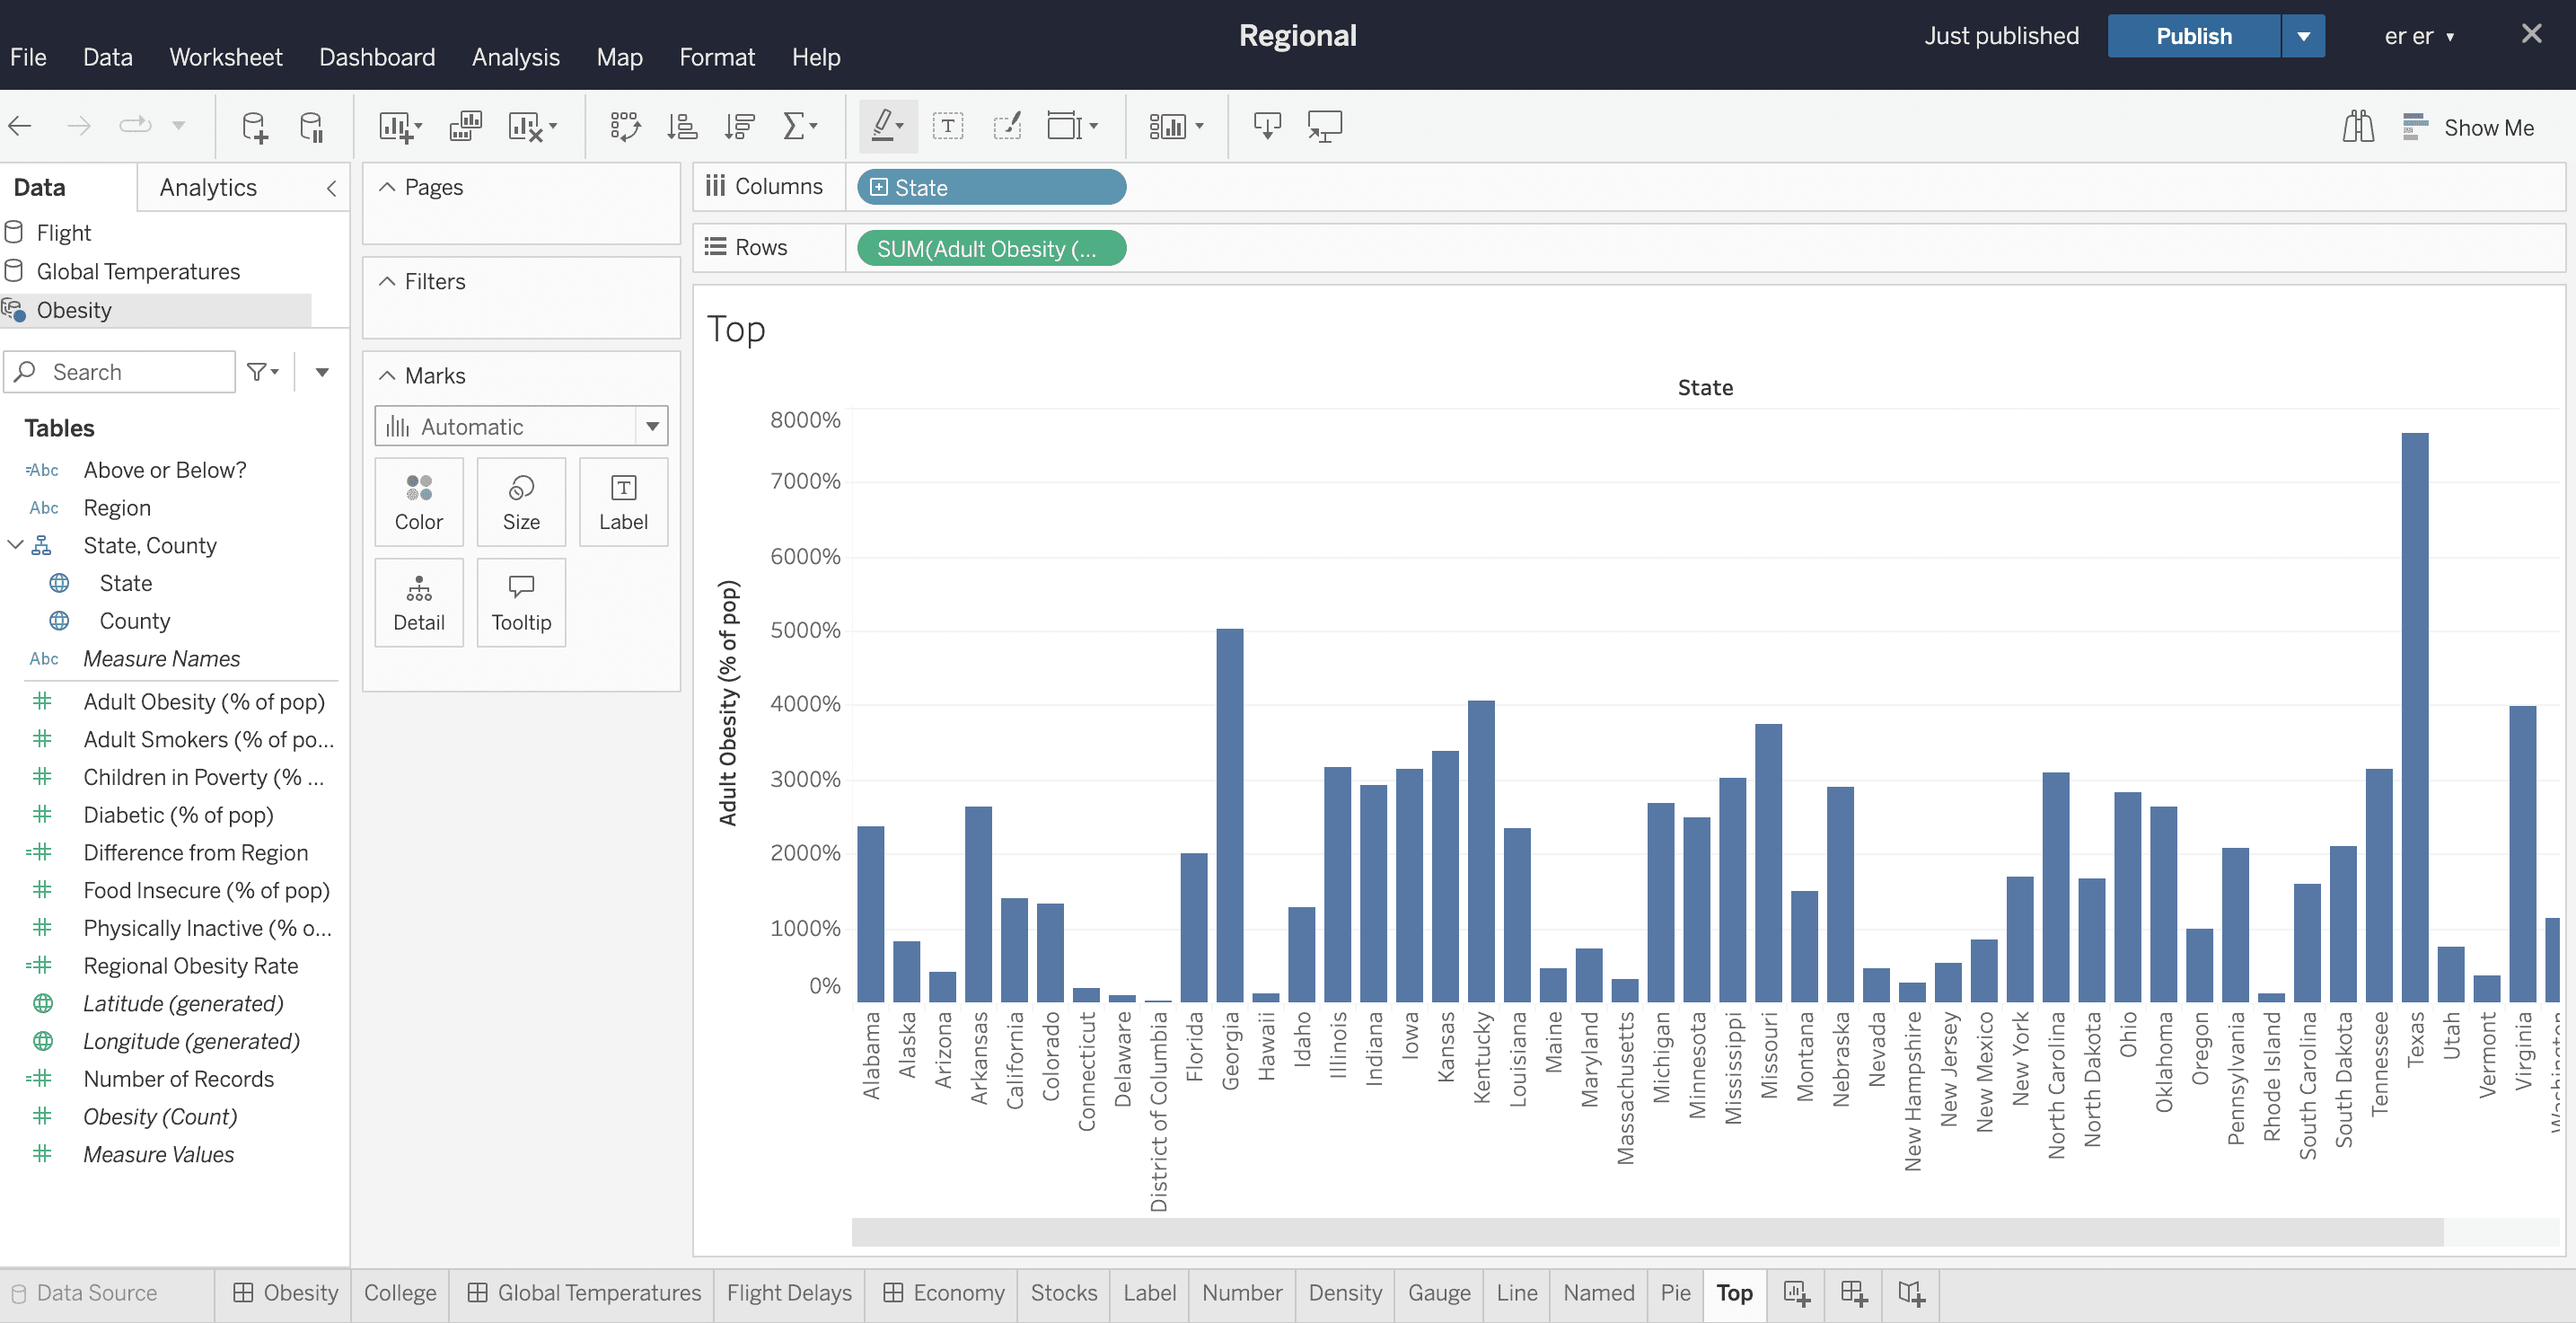
In the widget, choose the saved worksheet to see the top list chart of values for the chosen Measure along with Dimension names as postfixes.