


Google Spreadsheets Dashboard
Track & share your Google Spreadsheets KPIs in real-time with the Numerics dashboard app for your iPhone, iPad, Mac, Apple TV and Apple Watch.

Numerics business dashboard integrates with Google Spreadsheets giving you insights into your business performance and highlighting areas for growth or reconsideration. Visualize your business expenses, sales funnel, project status stored in Google Spreadsheets with intuitive line graphs, pie charts, top lists, number tallies and more in Numerics. Whether you are manually adding numbers to your spreadsheet or using macros to generate them, Numerics will present them beautifully.
Monitor KPIs from Google Spreadsheets with Numerics Dashboards on your iPhone, iPad, Mac, Apple TV and Apple Watch

Google Spreadsheets is a powerful tool to structurally record financial, statistical or any type of numerical data key to your business. Advanced spreadsheet macros and rich add-ons enable you to quickly model and manipulate data sets and pull in numbers from custom business software using APIs.
KPIs & Key Metrics for Google Spreadsheets Dashboards
Build live Custom Data dashboards using the pre-designed ActiveCampaign dashboard widgets or KPI templates listed below.
Basic
Create custom dashboards with the basic widget pack to track your most important number like sales revenue or inventory status.


Advanced
Get more insights into your business with custom line graphs, pie charts, density charts and more from spreadsheet data.


A Native Google Spreadsheets Dashboard App for all your Apple devices


Google Spreadsheets Metrics Everywhere!
Have your KPIs & metrics break out of your Custom Data dashboard app into other parts of your devices.
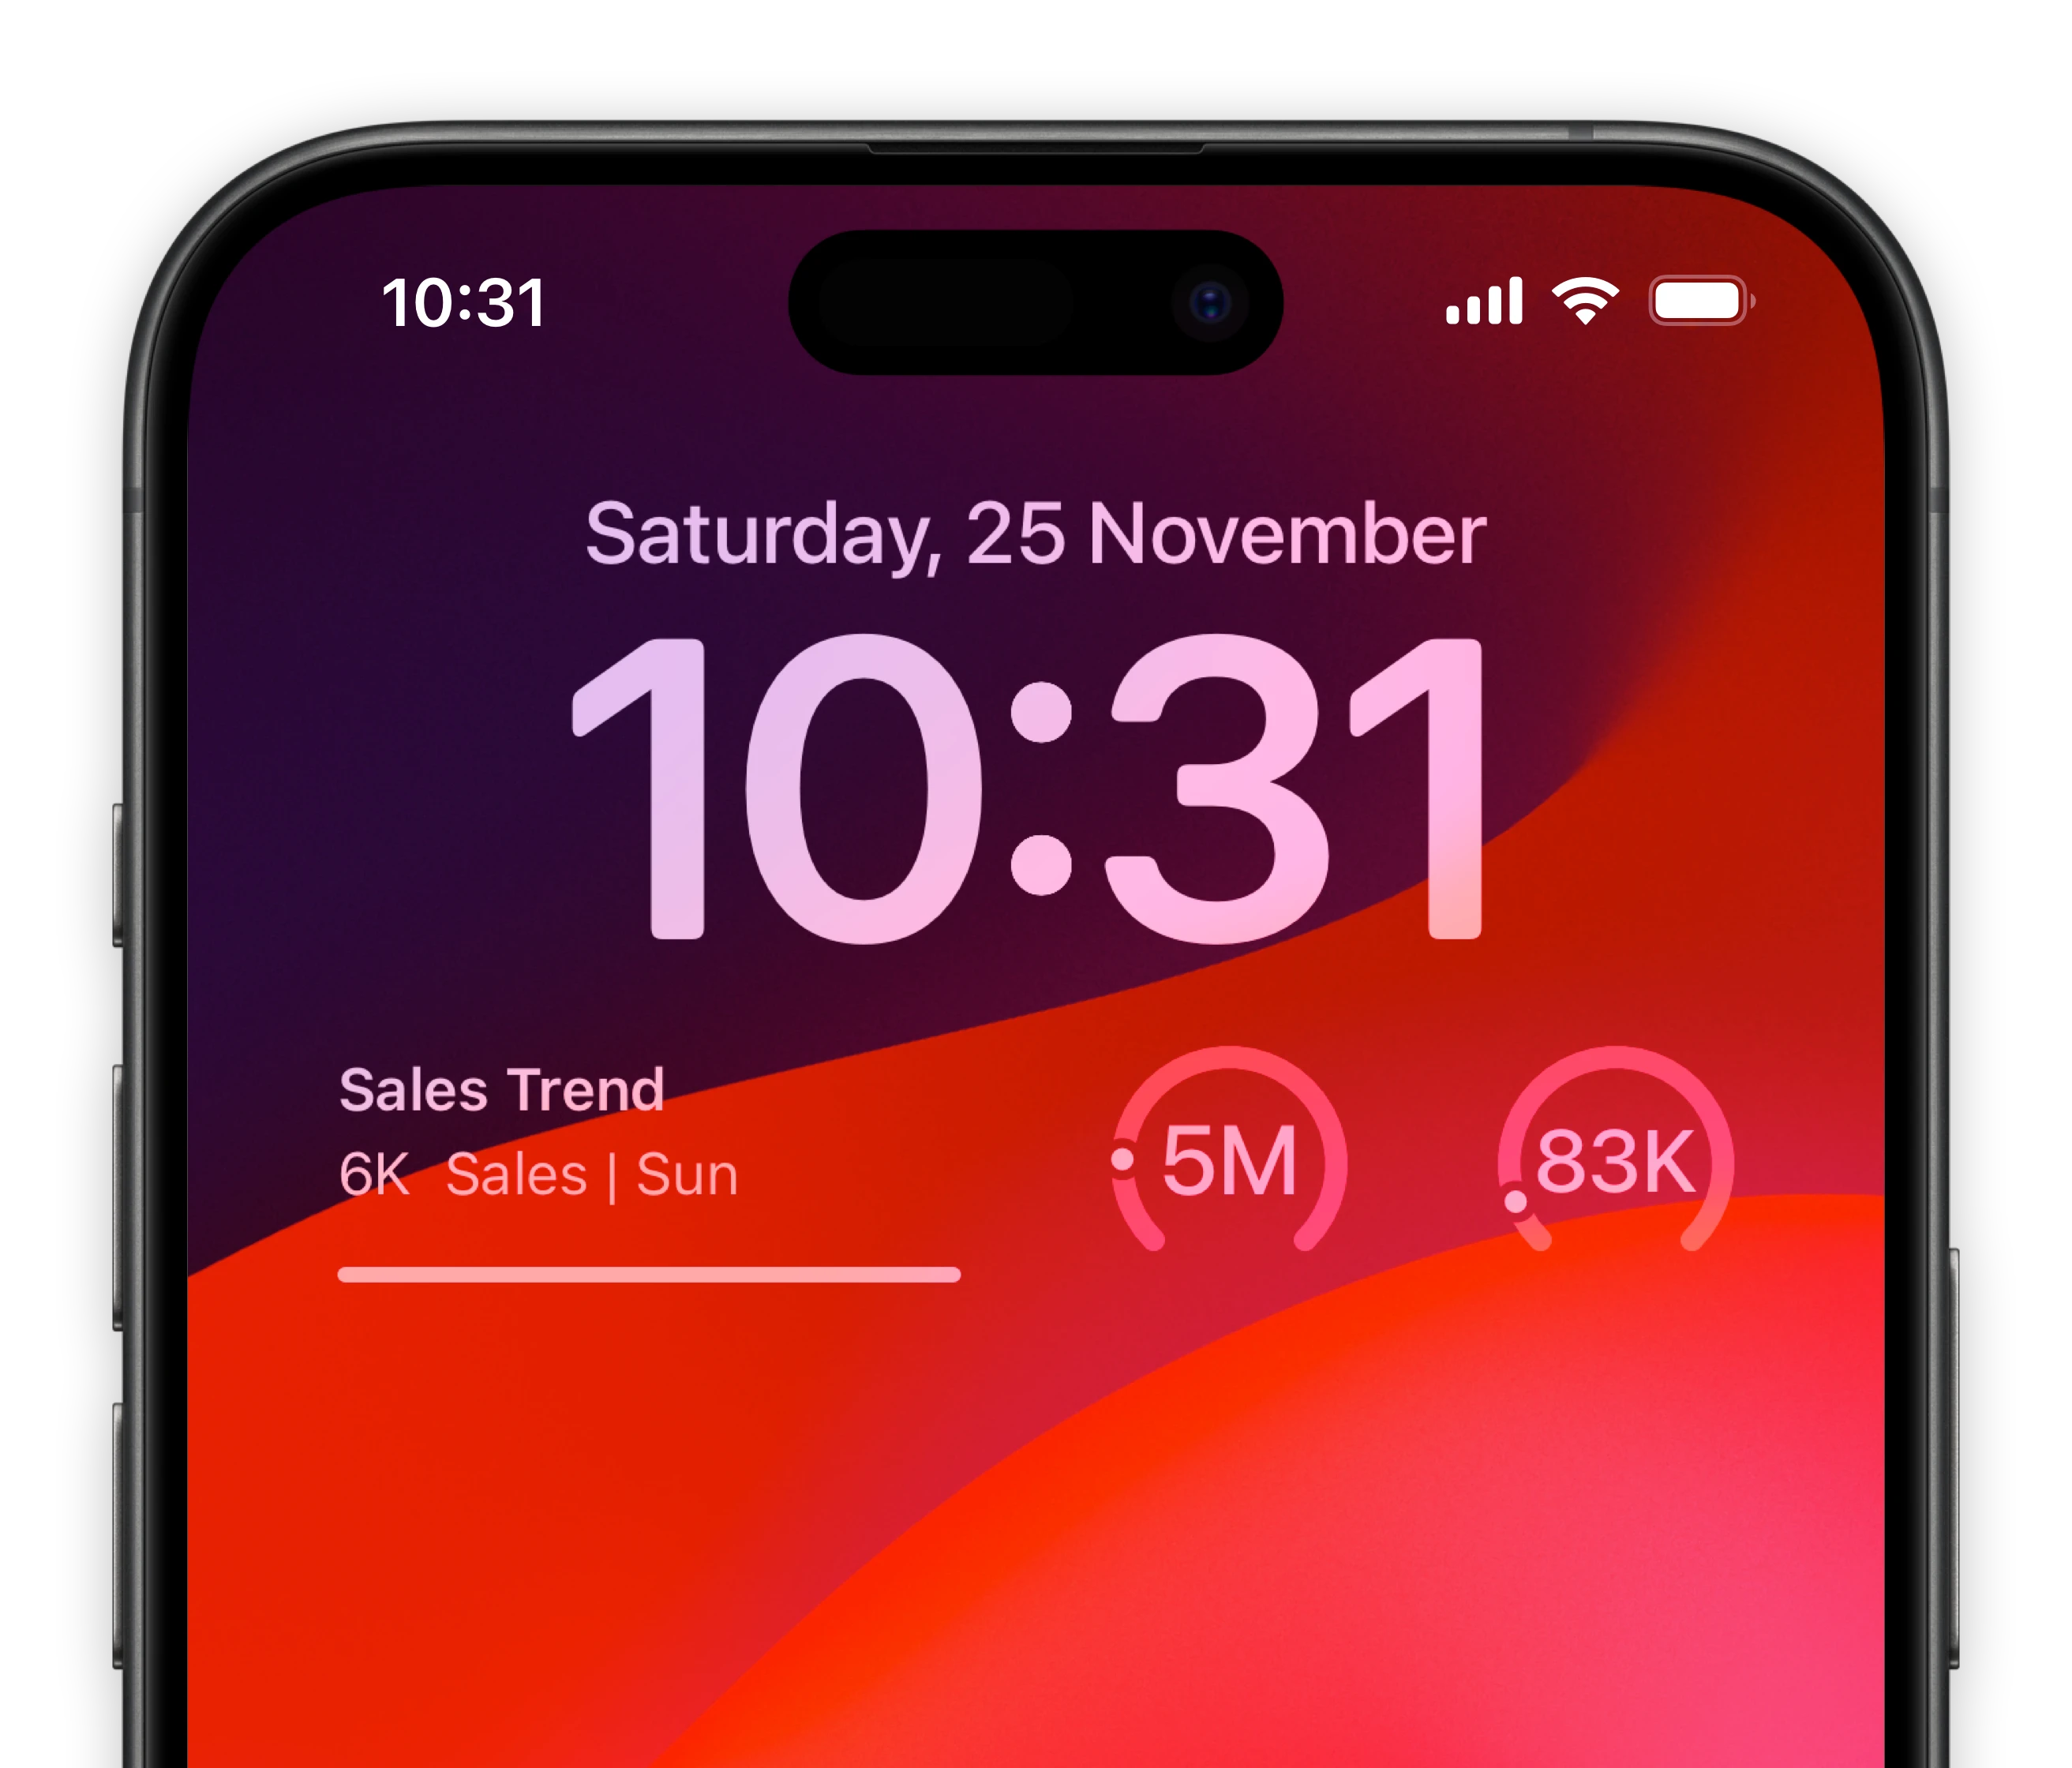
Lock-screen widgets on your iPhone.
Keep track of your most important metrics of Google Spreadsheets right from your iPhone lock screen.

Notification center widgets for your Mac.
Connect your Google Spreadsheets metrics to your MacOS sidebar.
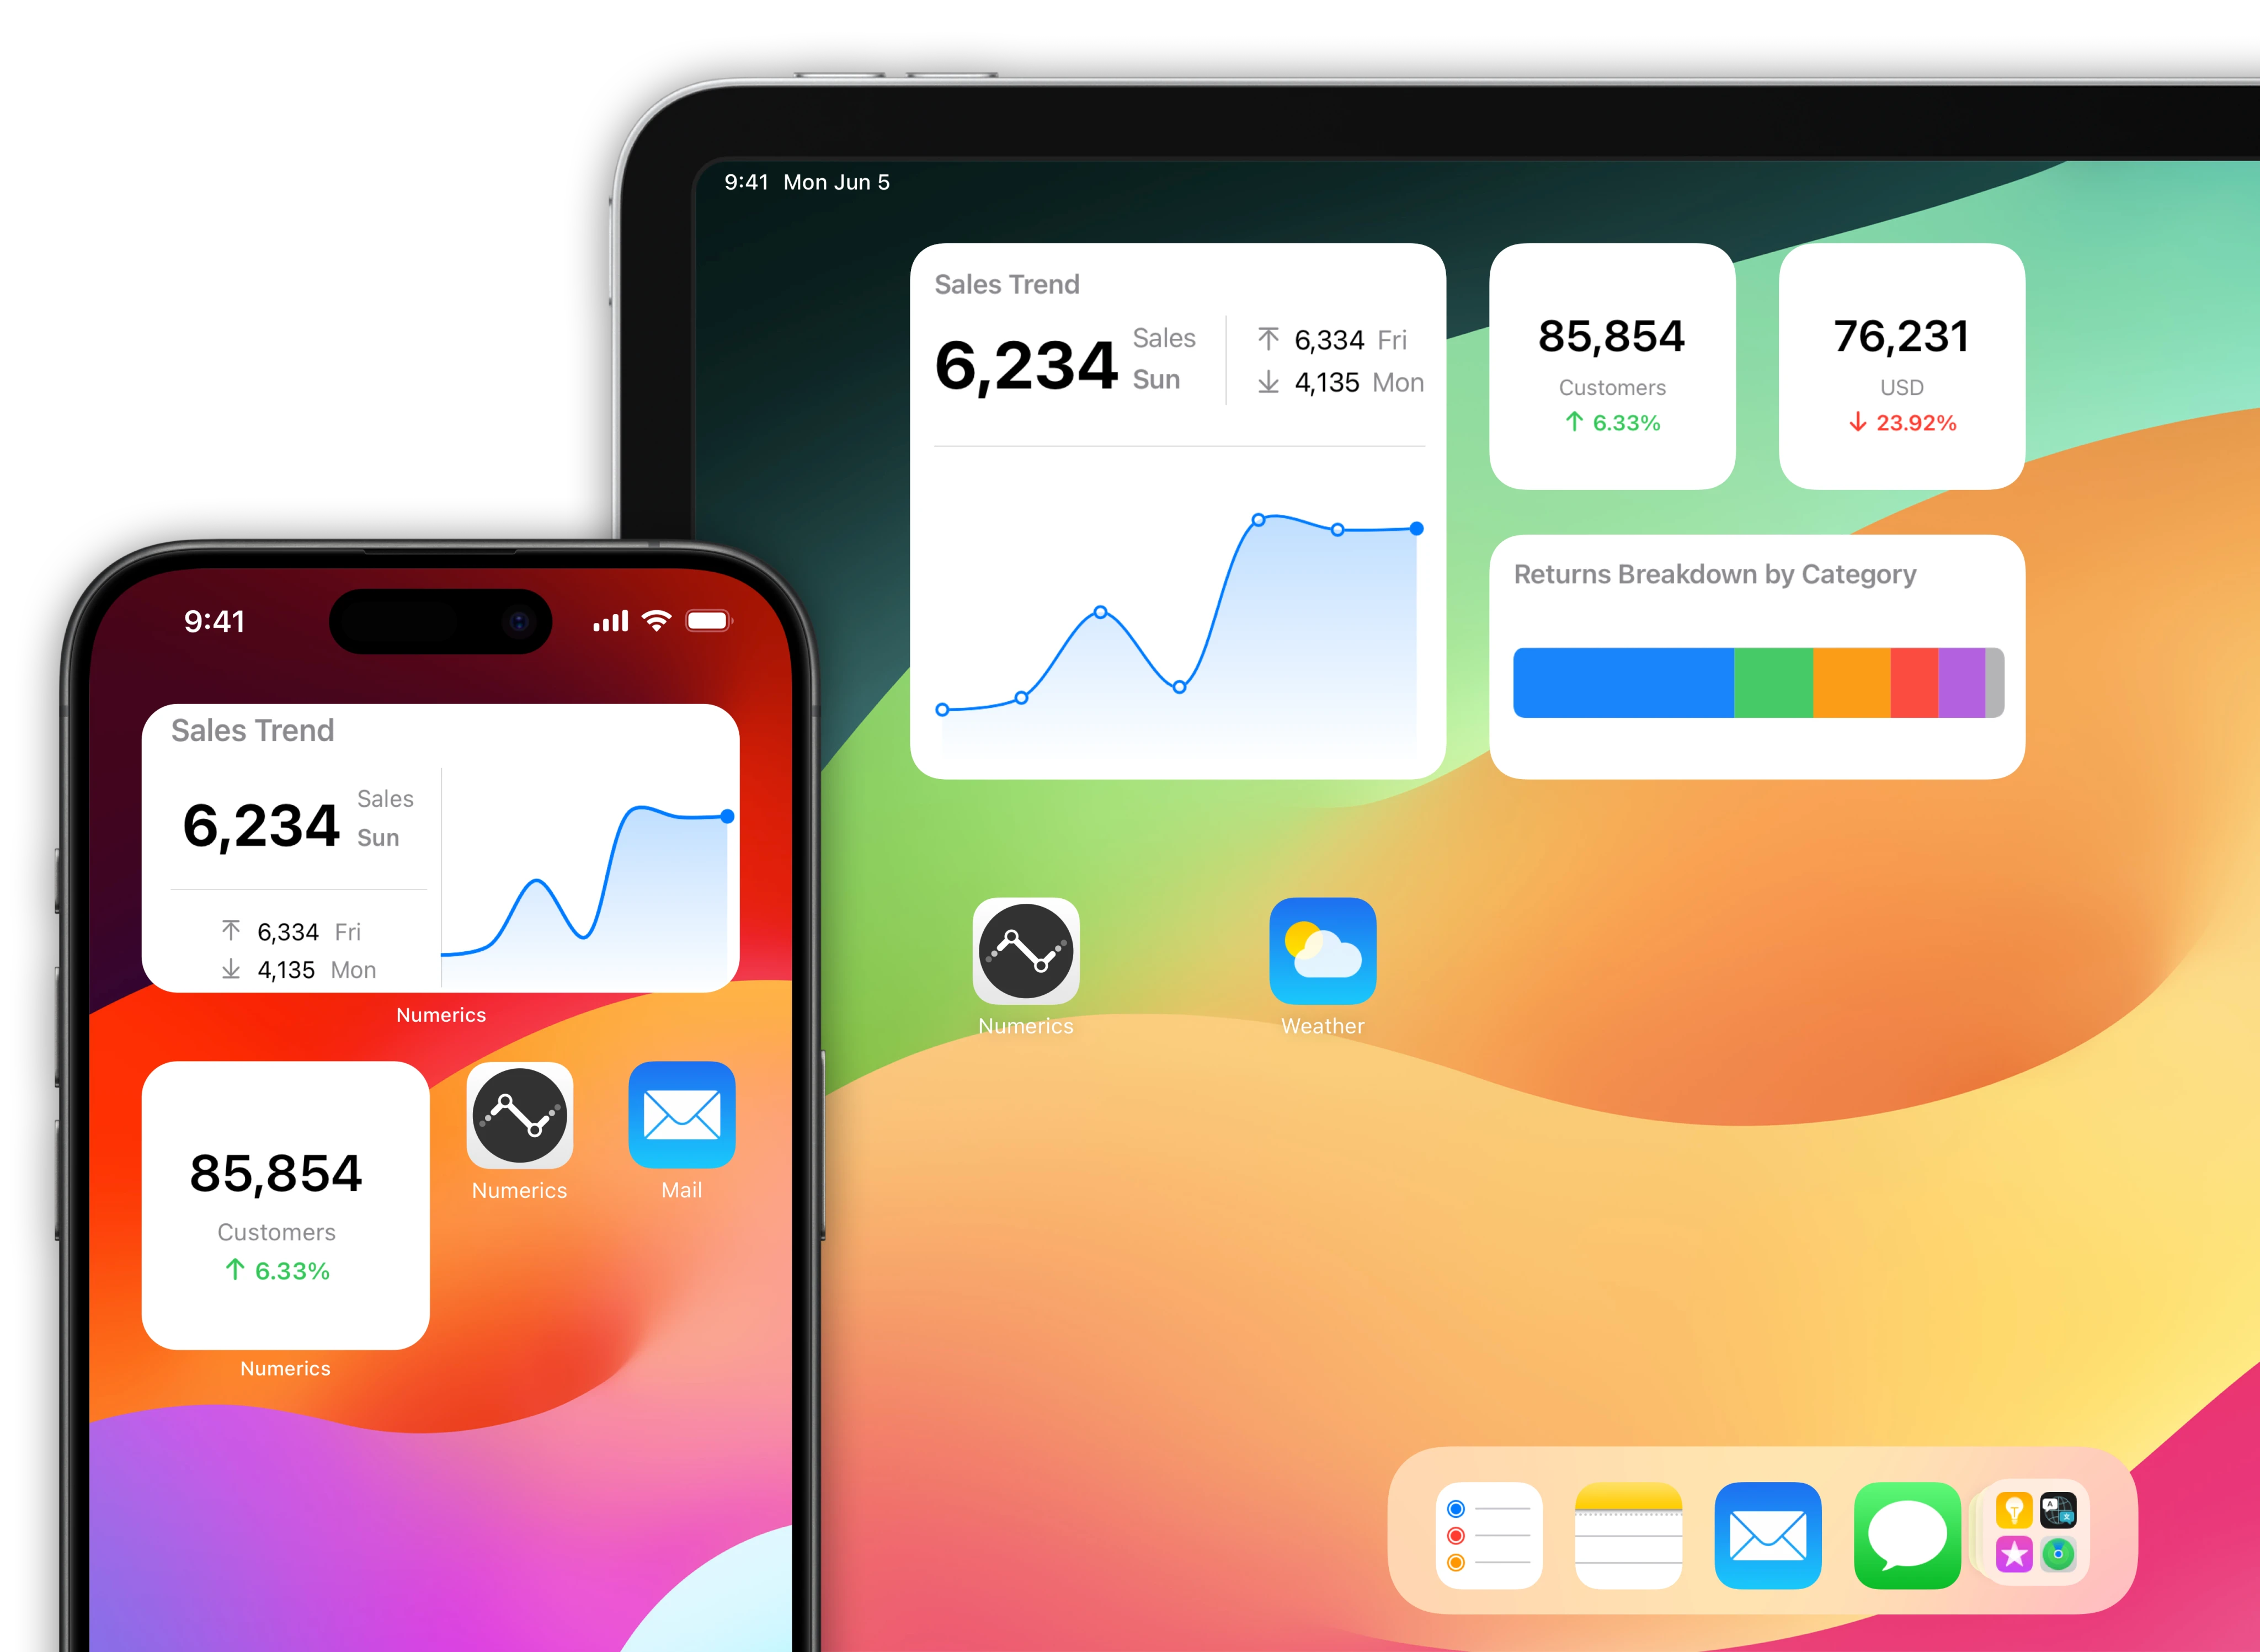
Google Spreadsheets data driven home screens for your iOS Devices.
Native home screen widgets for your iPad & iPhone powered by data from your Google Spreadsheets account.
Watch complications for your Apple Watch faces.
Design a custom Custom Data watch face using Google Spreadsheets data.

Make Siri Google Spreadsheets data aware!
"Hey Siri, what are my total sales this month?"
The value of total sales this month is 113,500 USD.

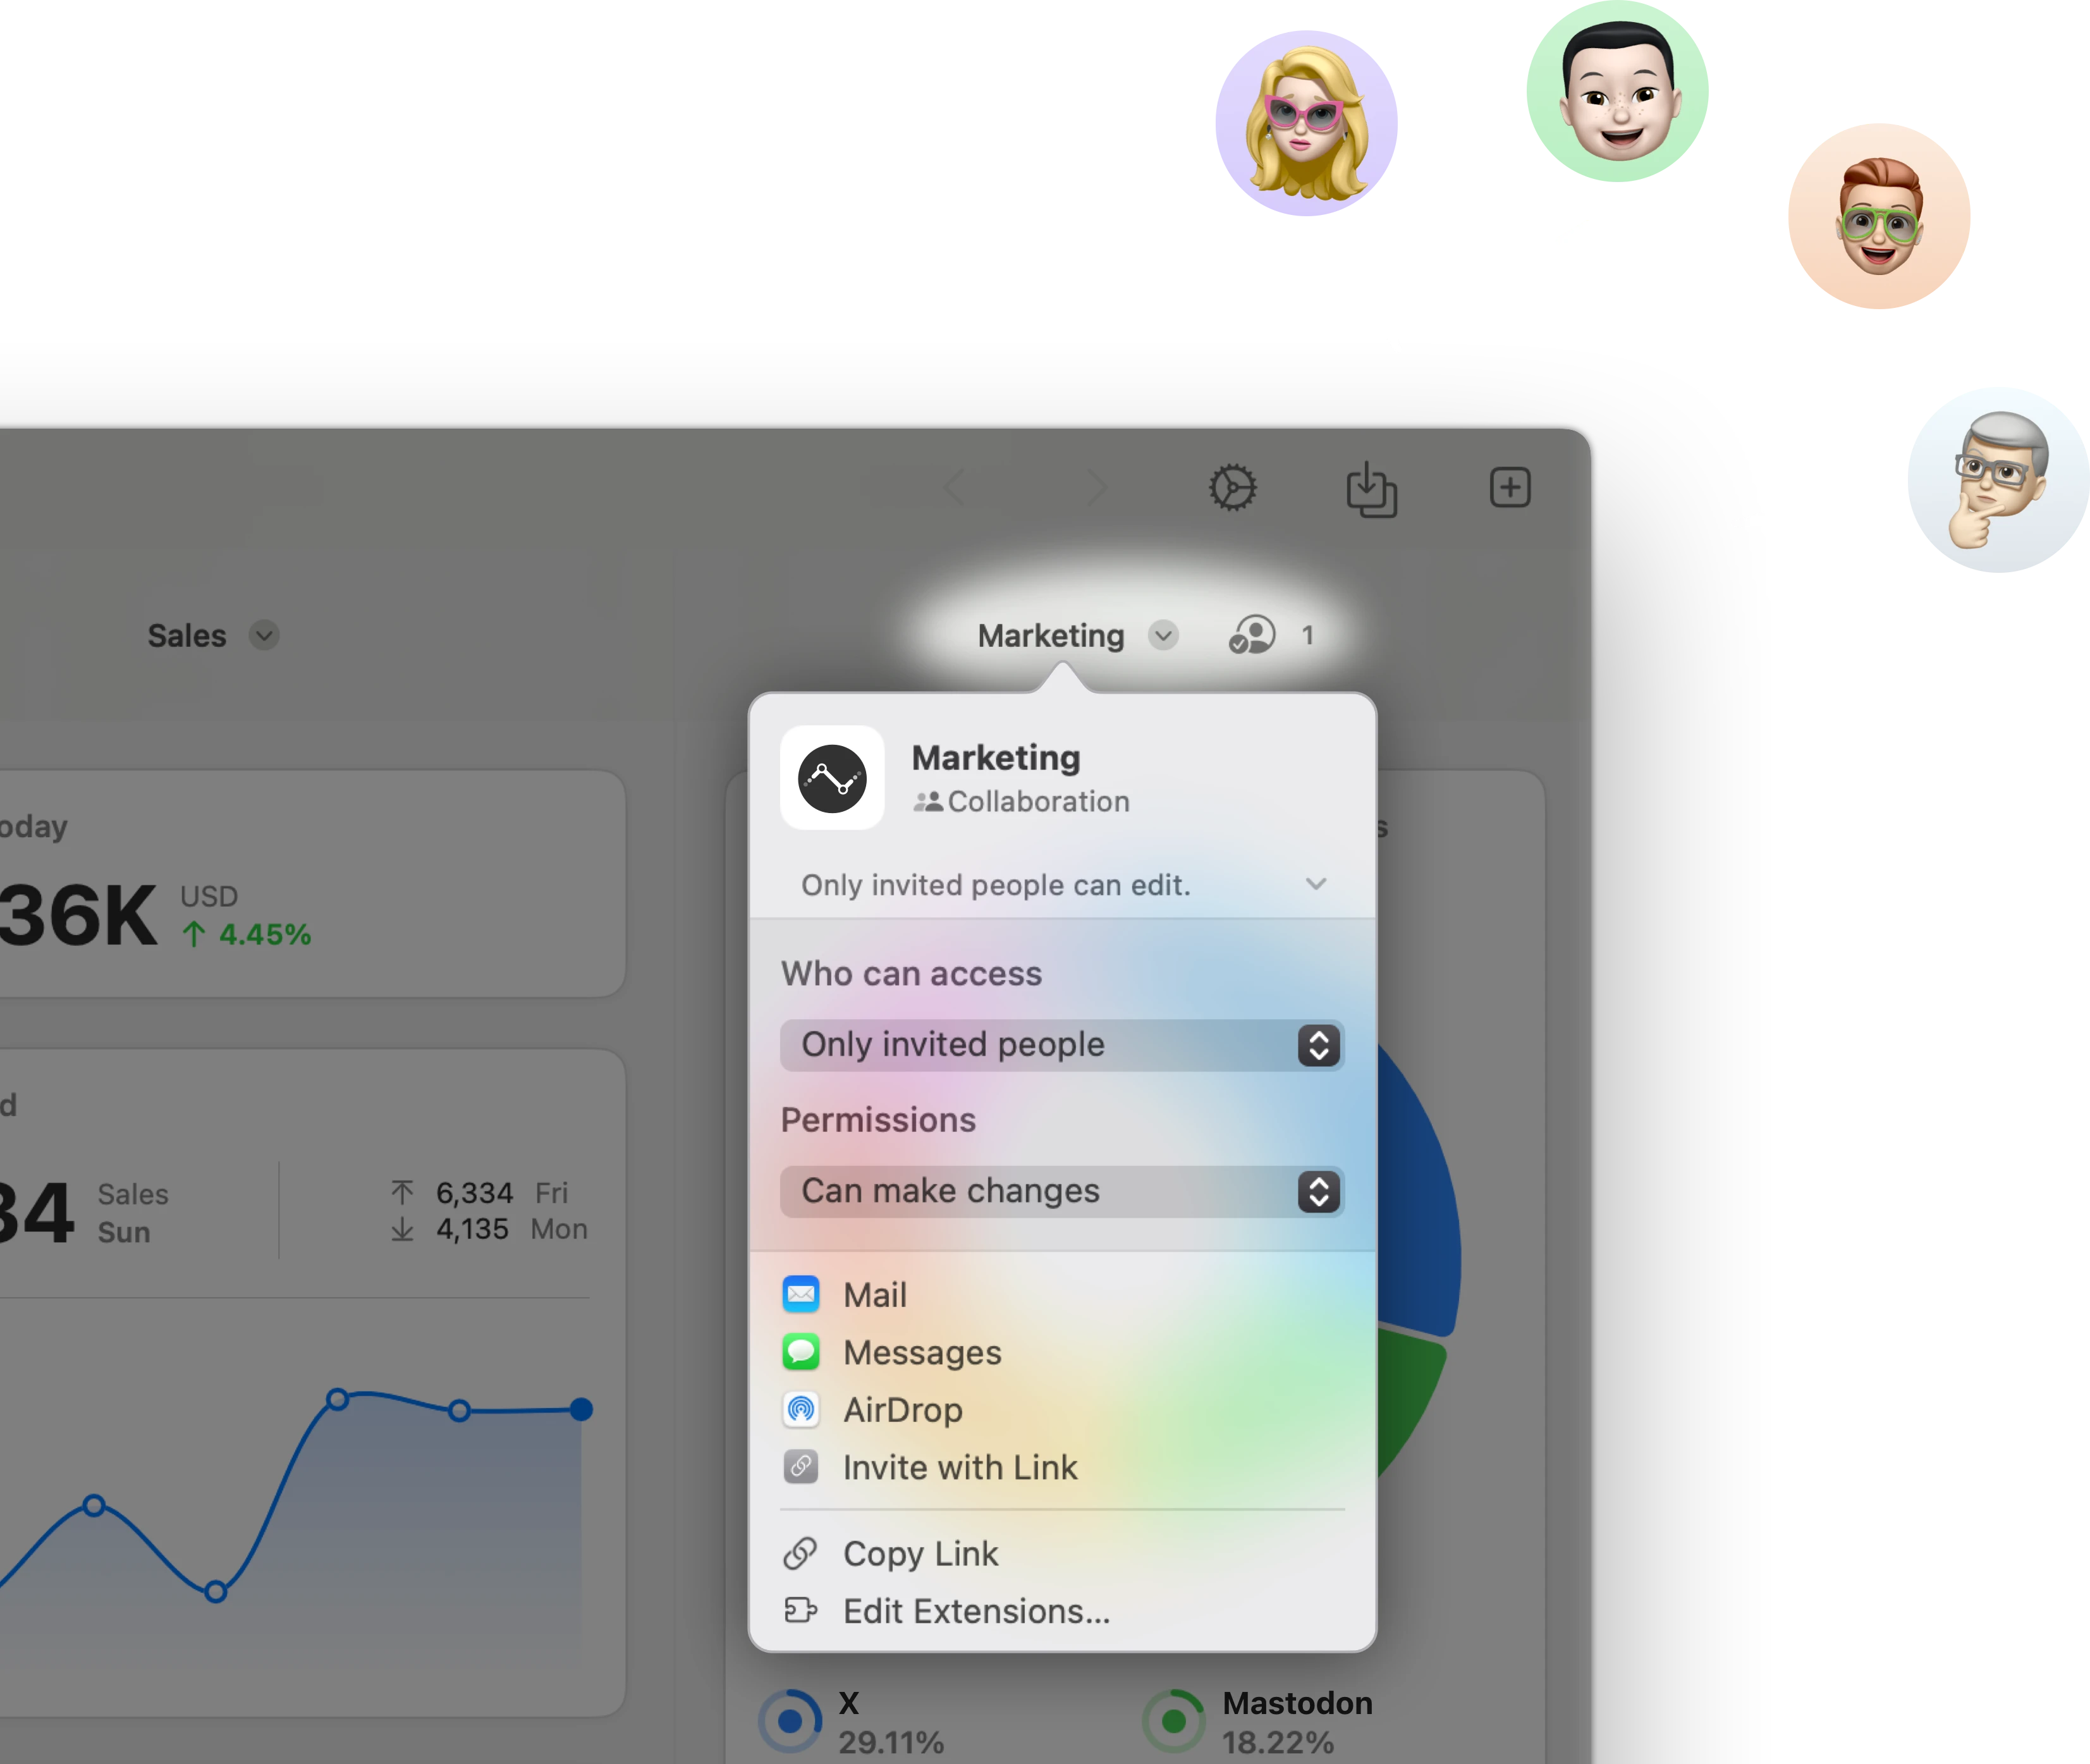
Stream & share Google Spreadsheets KPIs with other users.
Stream a Custom Data dashboard to other Numerics users & co-create dashboards with your team in real-time via secure iCloud sharing & collaboration with Messages.
Related Documents:

Related Blog Posts:
Google Spreadsheets Integration Specifications:
Authentication Type:
OAuth 2.0
Supported plans:
All

Customer Spotlight
Phil Steadman, VP of Operations - Ajax Mazda explains how they use Numerics across their 5 dealerships in Ontario, Canada.


