Pinterest Ads Dashboard Software
Pinterest Ads dashboard app

Pinterest Ads Dashboards

Track & share your Pinterest Ads KPIs in real-time with the Numerics dashboard app for your iPhone, iPad, Mac, Apple TV and Apple Watch.


Numerics integrates with Pinterest to provide in-depth insights and analysis of advertising campaigns. With Numerics, businesses can track key performance metrics such as reach, engagement, and conversions, and visualize data in customizable charts, graphs, and tables. This integration enables businesses to quickly identify trends and make data-driven decisions to optimize their advertising efforts on Pinterest. Numerics also provides real-time updates and notifications, so businesses can stay on top of their advertising performance at all times.

By integrating Numerics with Pinterest Ads, businesses can gain a better understanding of their audience, ad performance, and overall return on investment, helping them to make more informed decisions and achieve their marketing goals.

Pinterest Ads Social Media Marketing Logo

Pinterest is a visual discovery engine for finding ideas like recipes, home and style inspiration, and more. With billions of Pins on Pinterest, you’ll always find ideas to spark inspiration. When you discover Pins you love, save them to boards to keep your ideas organized and easy to find. You can also create Pins to share your ideas with other people on Pinterest.

132

Pre-built Pinterest Ads KPI Templates.

Easy-to-use widget templates that serve as the building blocks to customizing your Pinterest Ads dashboard.

Easy custom marketing dashboard design.

Connect with your Pinterest Ads account and create your own dashboards in minutes. No coding or training is required.

Pinterest Ads Dashboard Setup Guide

Secure, direct device-to-Pinterest Ads connections.

The only Pinterest Ads Dashboard tool on the planet that does not replicate your data and connects to the Pinterest Ads servers directly from your devices. No intermediary cloud servers, secure by design.

KPIs & Key Metrics for Pinterest Ads Dashboards

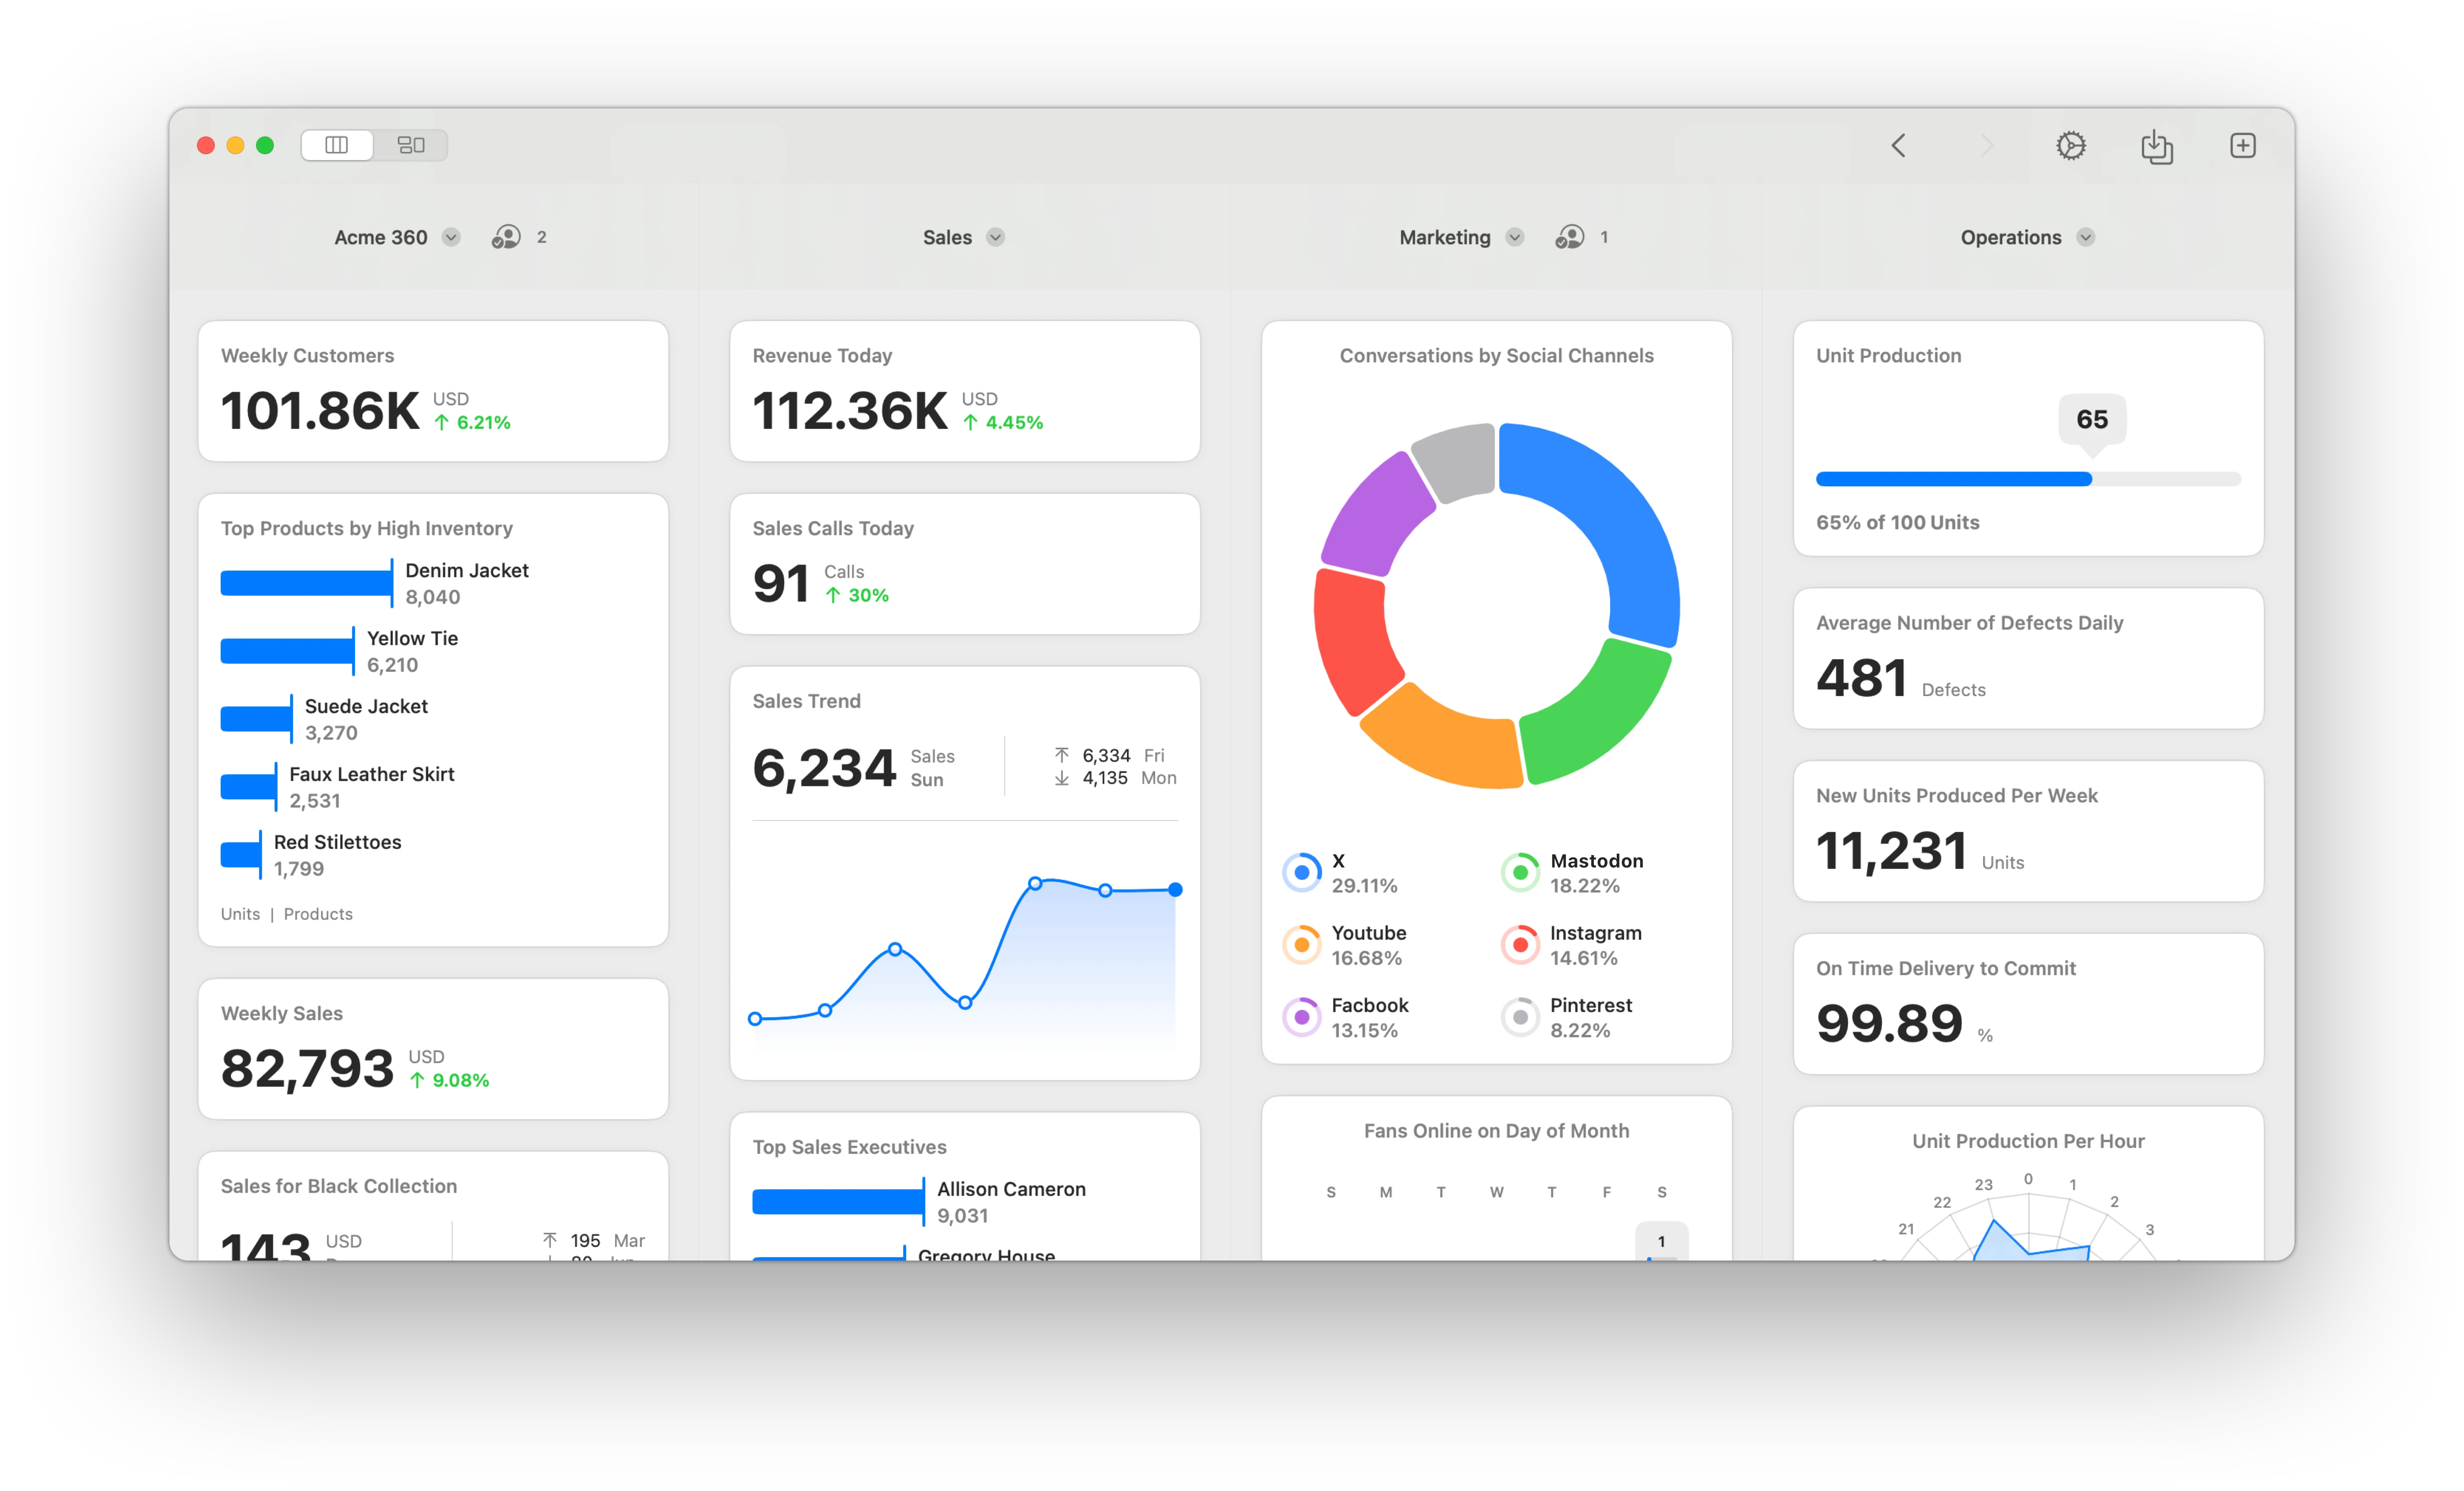
Build live marketing dashboards using the pre-designed Pinterest Ads dashboard widgets or KPI templates listed below.

General

Dashboard Visualization Type: Gauge.

Engagement rate

The gauge showing the rate of engagements such as click, save, closeup, carousel sideswipe compared to all impressions for your chosen time span.

Dashboard Visualization Type: Line Graph.

Engagement rate trend

The trend of user engagement rates plotted on a line graph for your chosen time span.

Dashboard Visualization Type: Number.

Engagements

The total of all user engagements such as click, save, closeup, carousel sideswipe, for your chosen time span.

Dashboard Visualization Type: Line Graph.

Engagements trend

The trend of user engagements plotted on a line graph for your chosen time span.

Dashboard Visualization Type: Pie Chart.

Engagements by app types

The number of engagements broken down by app types for your chosen time span.

Dashboard Visualization Type: Pie Chart.

Engagements by pin formats

The number of engagements broken down by pin formats for your chosen time span.

Ad Account Conversions

Dashboard Visualization Type: Number.

Checkouts

The total number of your chosen checkout metric for your chosen time span.

Dashboard Visualization Type: Line Graph.

Checkouts trend

The trend of your chosen checkout metric plotted on a line graph for your chosen time span.

Dashboard Visualization Type: Number.

Clicks

The total number of your chosen click metric for your chosen time span.

Dashboard Visualization Type: Line Graph.

Clicks trend

The trend of your chosen click metric plotted on a line graph for your chosen time span.

Dashboard Visualization Type: Number.

Clickthroughs

The total number of your chosen clickthrough metric for your chosen time span.

Dashboard Visualization Type: Line Graph.

Clickthroughs trend

The trend of your chosen clickthrough metric plotted on a line graph for your chosen time span.

Ad Campaign Conversions

Dashboard Visualization Type: Number.

Checkouts

The total number of your chosen checkout metric for your chosen time span.

Dashboard Visualization Type: Line Graph.

Checkouts trend

The trend of your chosen checkout metric plotted on a line graph for your chosen time span.

Dashboard Visualization Type: Number.

Clicks

The total number of your chosen click metric for your chosen time span.

Dashboard Visualization Type: Line Graph.

Clicks trend

The trend of your chosen click metric plotted on a line graph for your chosen time span.

Dashboard Visualization Type: Number.

Clickthroughs

The total number of your chosen clickthrough metric for your chosen time span.

Dashboard Visualization Type: Line Graph.

Clickthroughs trend

The trend of your chosen clickthrough metric plotted on a line graph for your chosen time span.

Ad Group Conversions

Dashboard Visualization Type: Number.

Checkouts

The total number of your chosen checkout metric for your chosen time span.

Dashboard Visualization Type: Line Graph.

Checkouts trend

The trend of your chosen checkout metric plotted on a line graph for your chosen time span.

Dashboard Visualization Type: Number.

Clicks

The total number of your chosen click metric for your chosen time span.

Dashboard Visualization Type: Line Graph.

Clicks trend

The trend of your chosen click metric plotted on a line graph for your chosen time span.

Dashboard Visualization Type: Number.

Clickthroughs

The total number of your chosen clickthrough metric for your chosen time span.

Dashboard Visualization Type: Line Graph.

Clickthroughs trend

The trend of your chosen clickthrough metric plotted on a line graph for your chosen time span.

Ad Conversions

Dashboard Visualization Type: Number.

Checkouts

The total number of your chosen checkout metric for your chosen time span.

Dashboard Visualization Type: Line Graph.

Checkouts trend

The trend of your chosen checkout metric plotted on a line graph for your chosen time span.

Dashboard Visualization Type: Number.

Clicks

The total number of your chosen click metric for your chosen time span.

Dashboard Visualization Type: Line Graph.

Clicks trend

The trend of your chosen click metric plotted on a line graph for your chosen time span.

Dashboard Visualization Type: Number.

Clickthroughs

The total number of your chosen clickthrough metric for your chosen time span.

Dashboard Visualization Type: Line Graph.

Clickthroughs trend

The trend of your chosen clickthrough metric plotted on a line graph for your chosen time span.

Pinterest Ads Metrics Everywhere!

Have your KPIs & metrics break out of your marketing dashboard app into other parts of your devices.

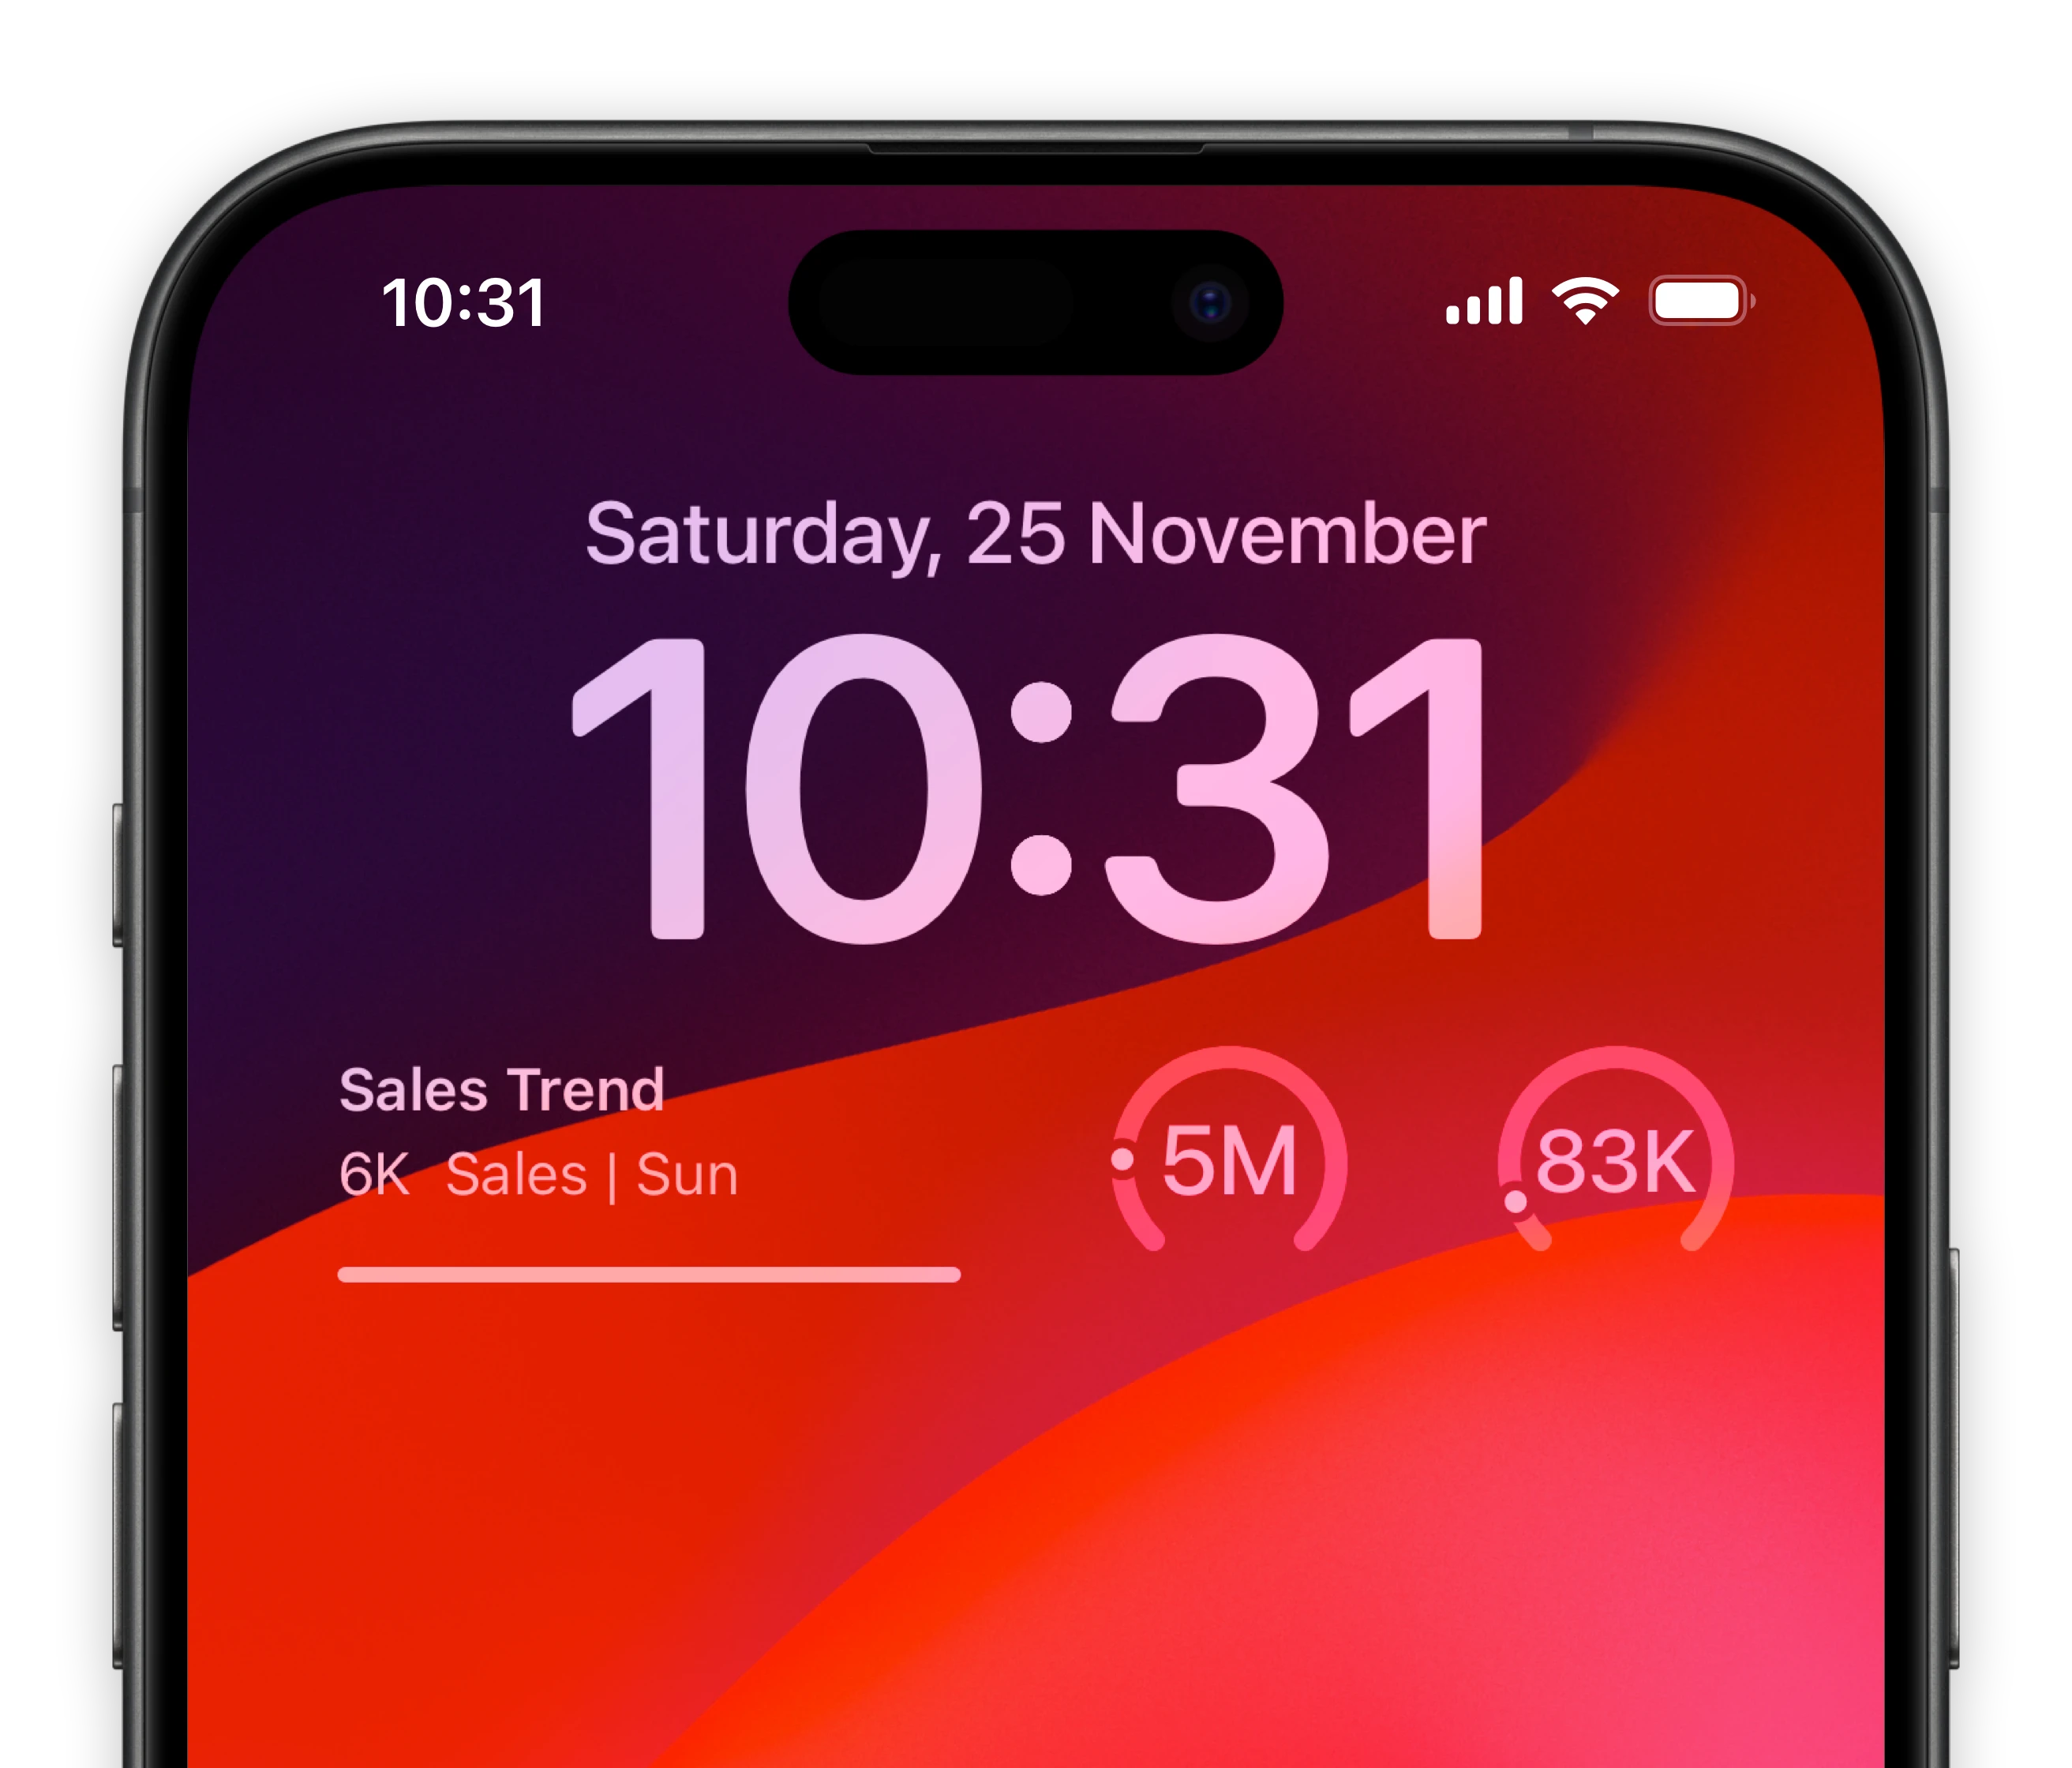
Lock-screen widgets on your iPhone.

Keep track of your most important social media marketing metrics of Pinterest Ads right from your iPhone lock screen.

Micro Pinterest Ads dashboards for your iOS Lock-screens
A mini Pinterest Ads dashboard for your MacOS Notification Center

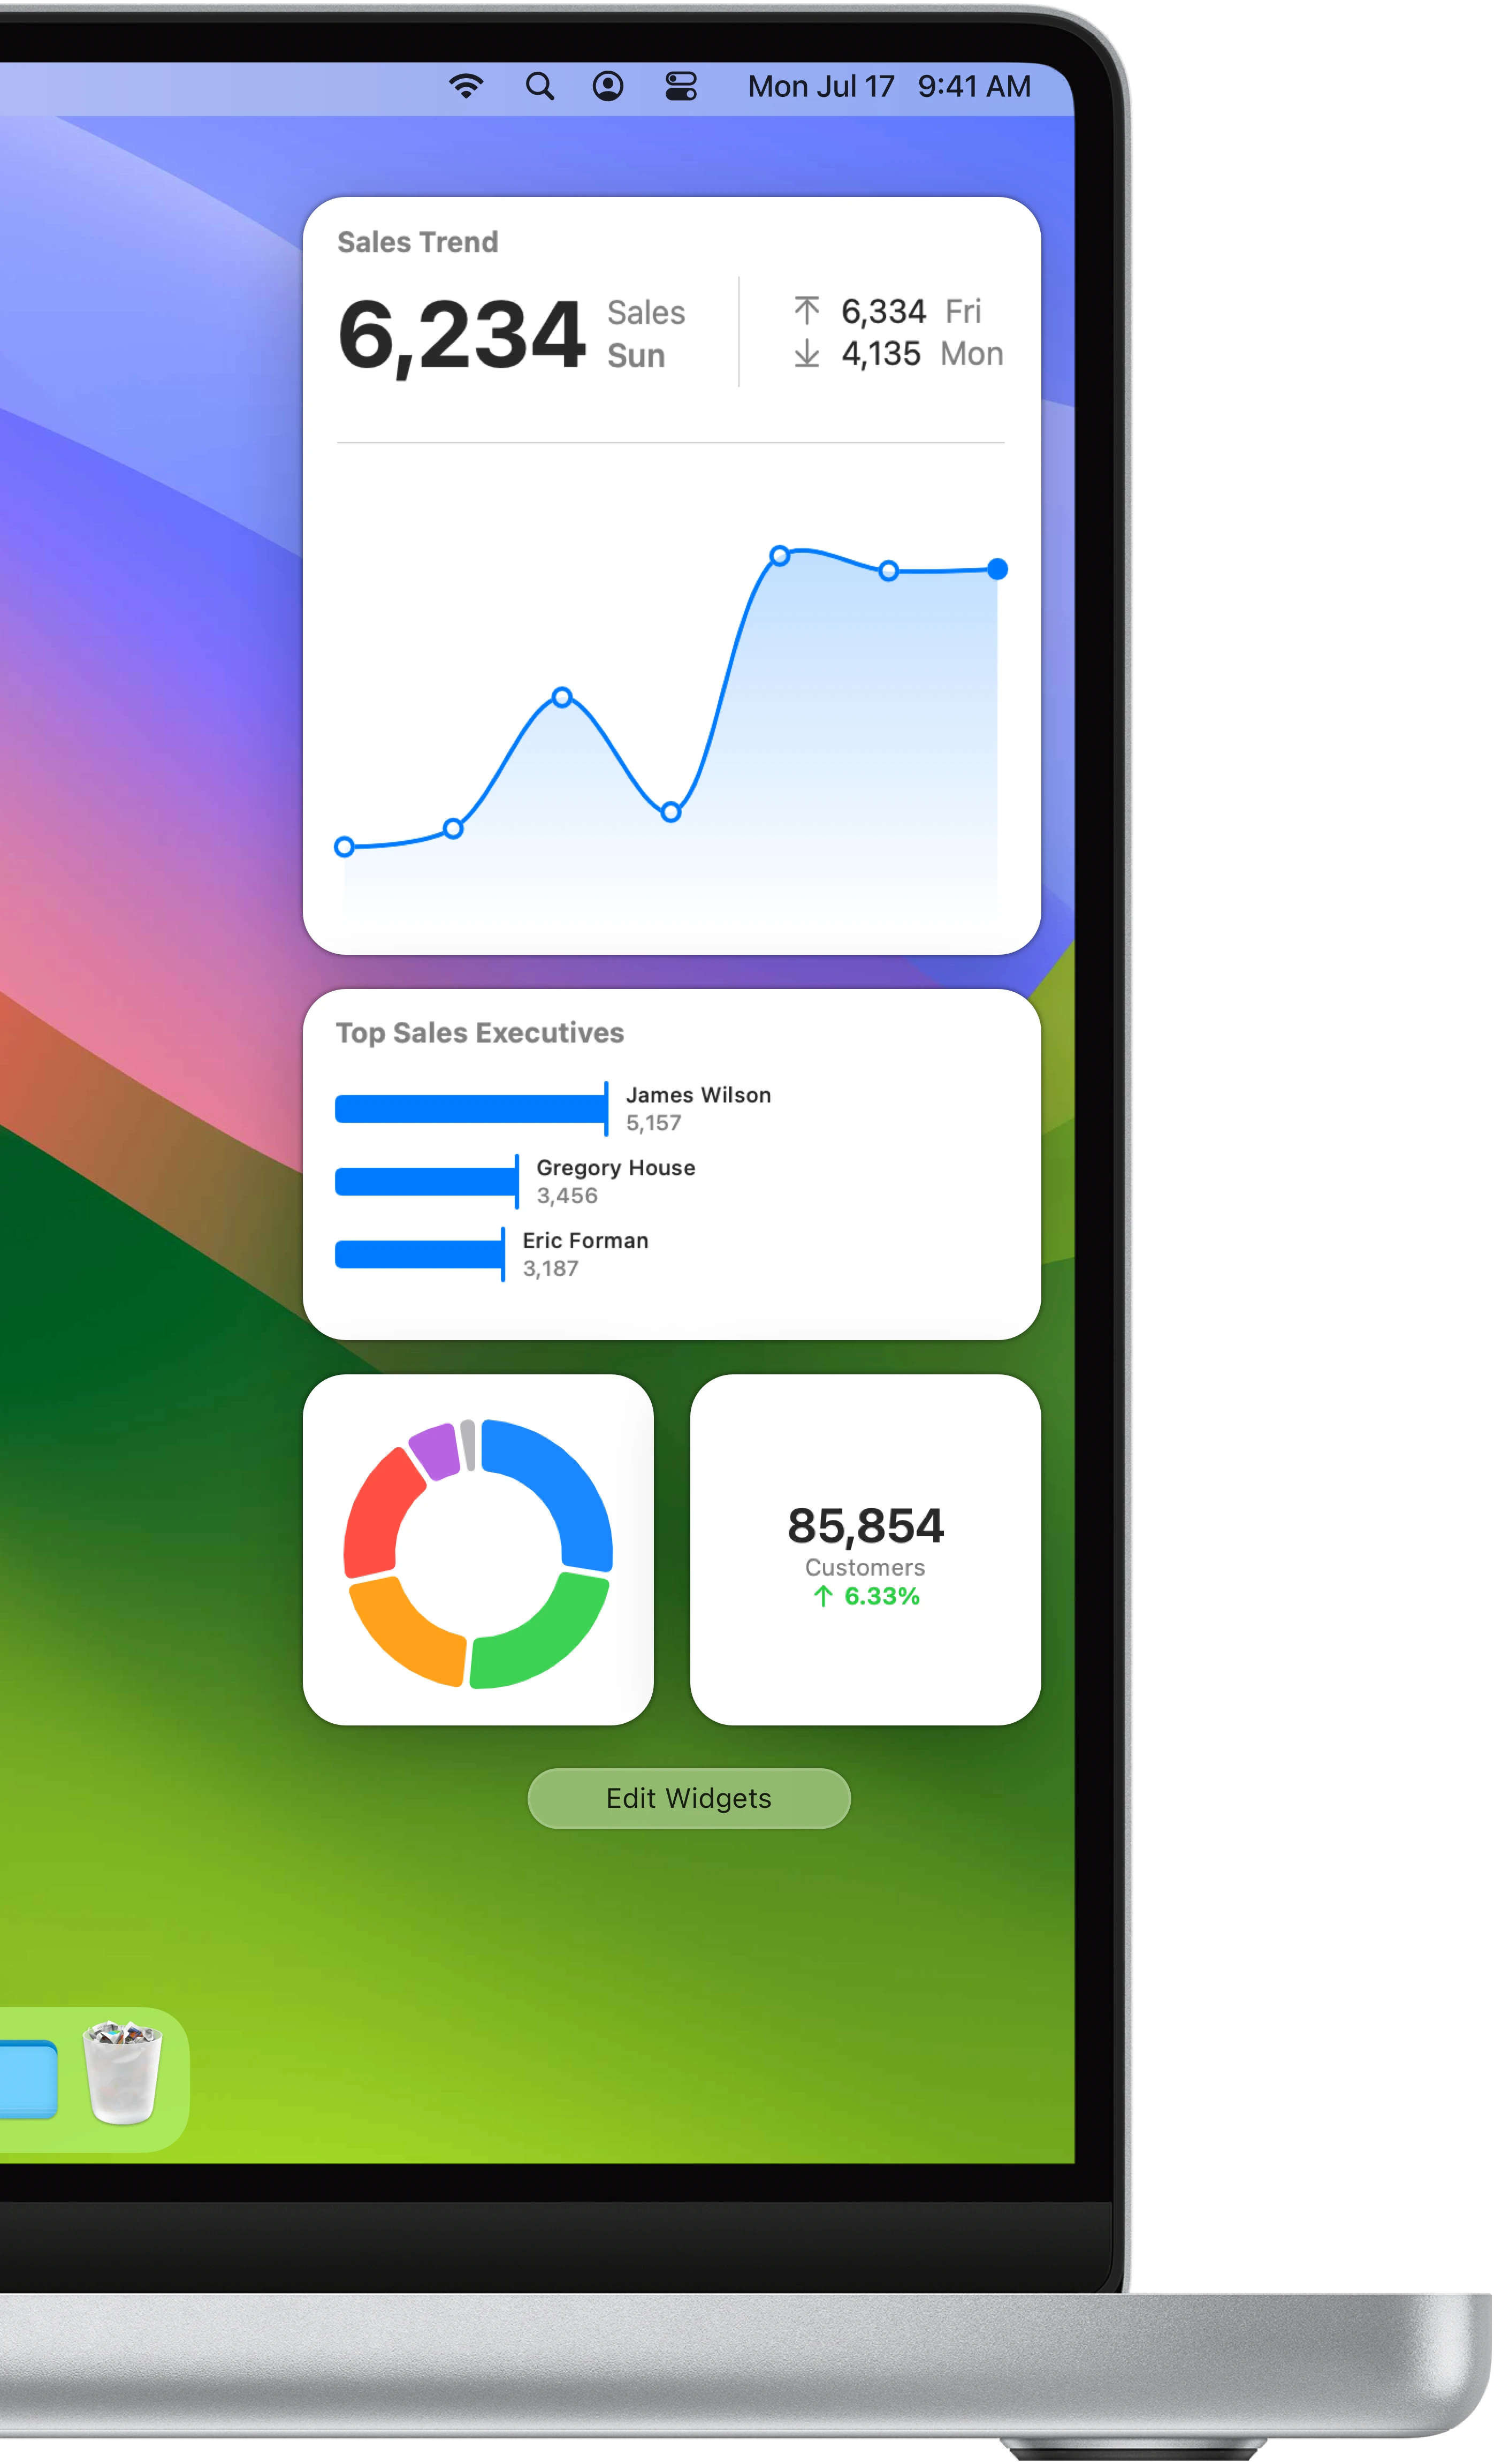
Notification center widgets for your Mac.

Connect your Pinterest Ads metrics to your MacOS sidebar.

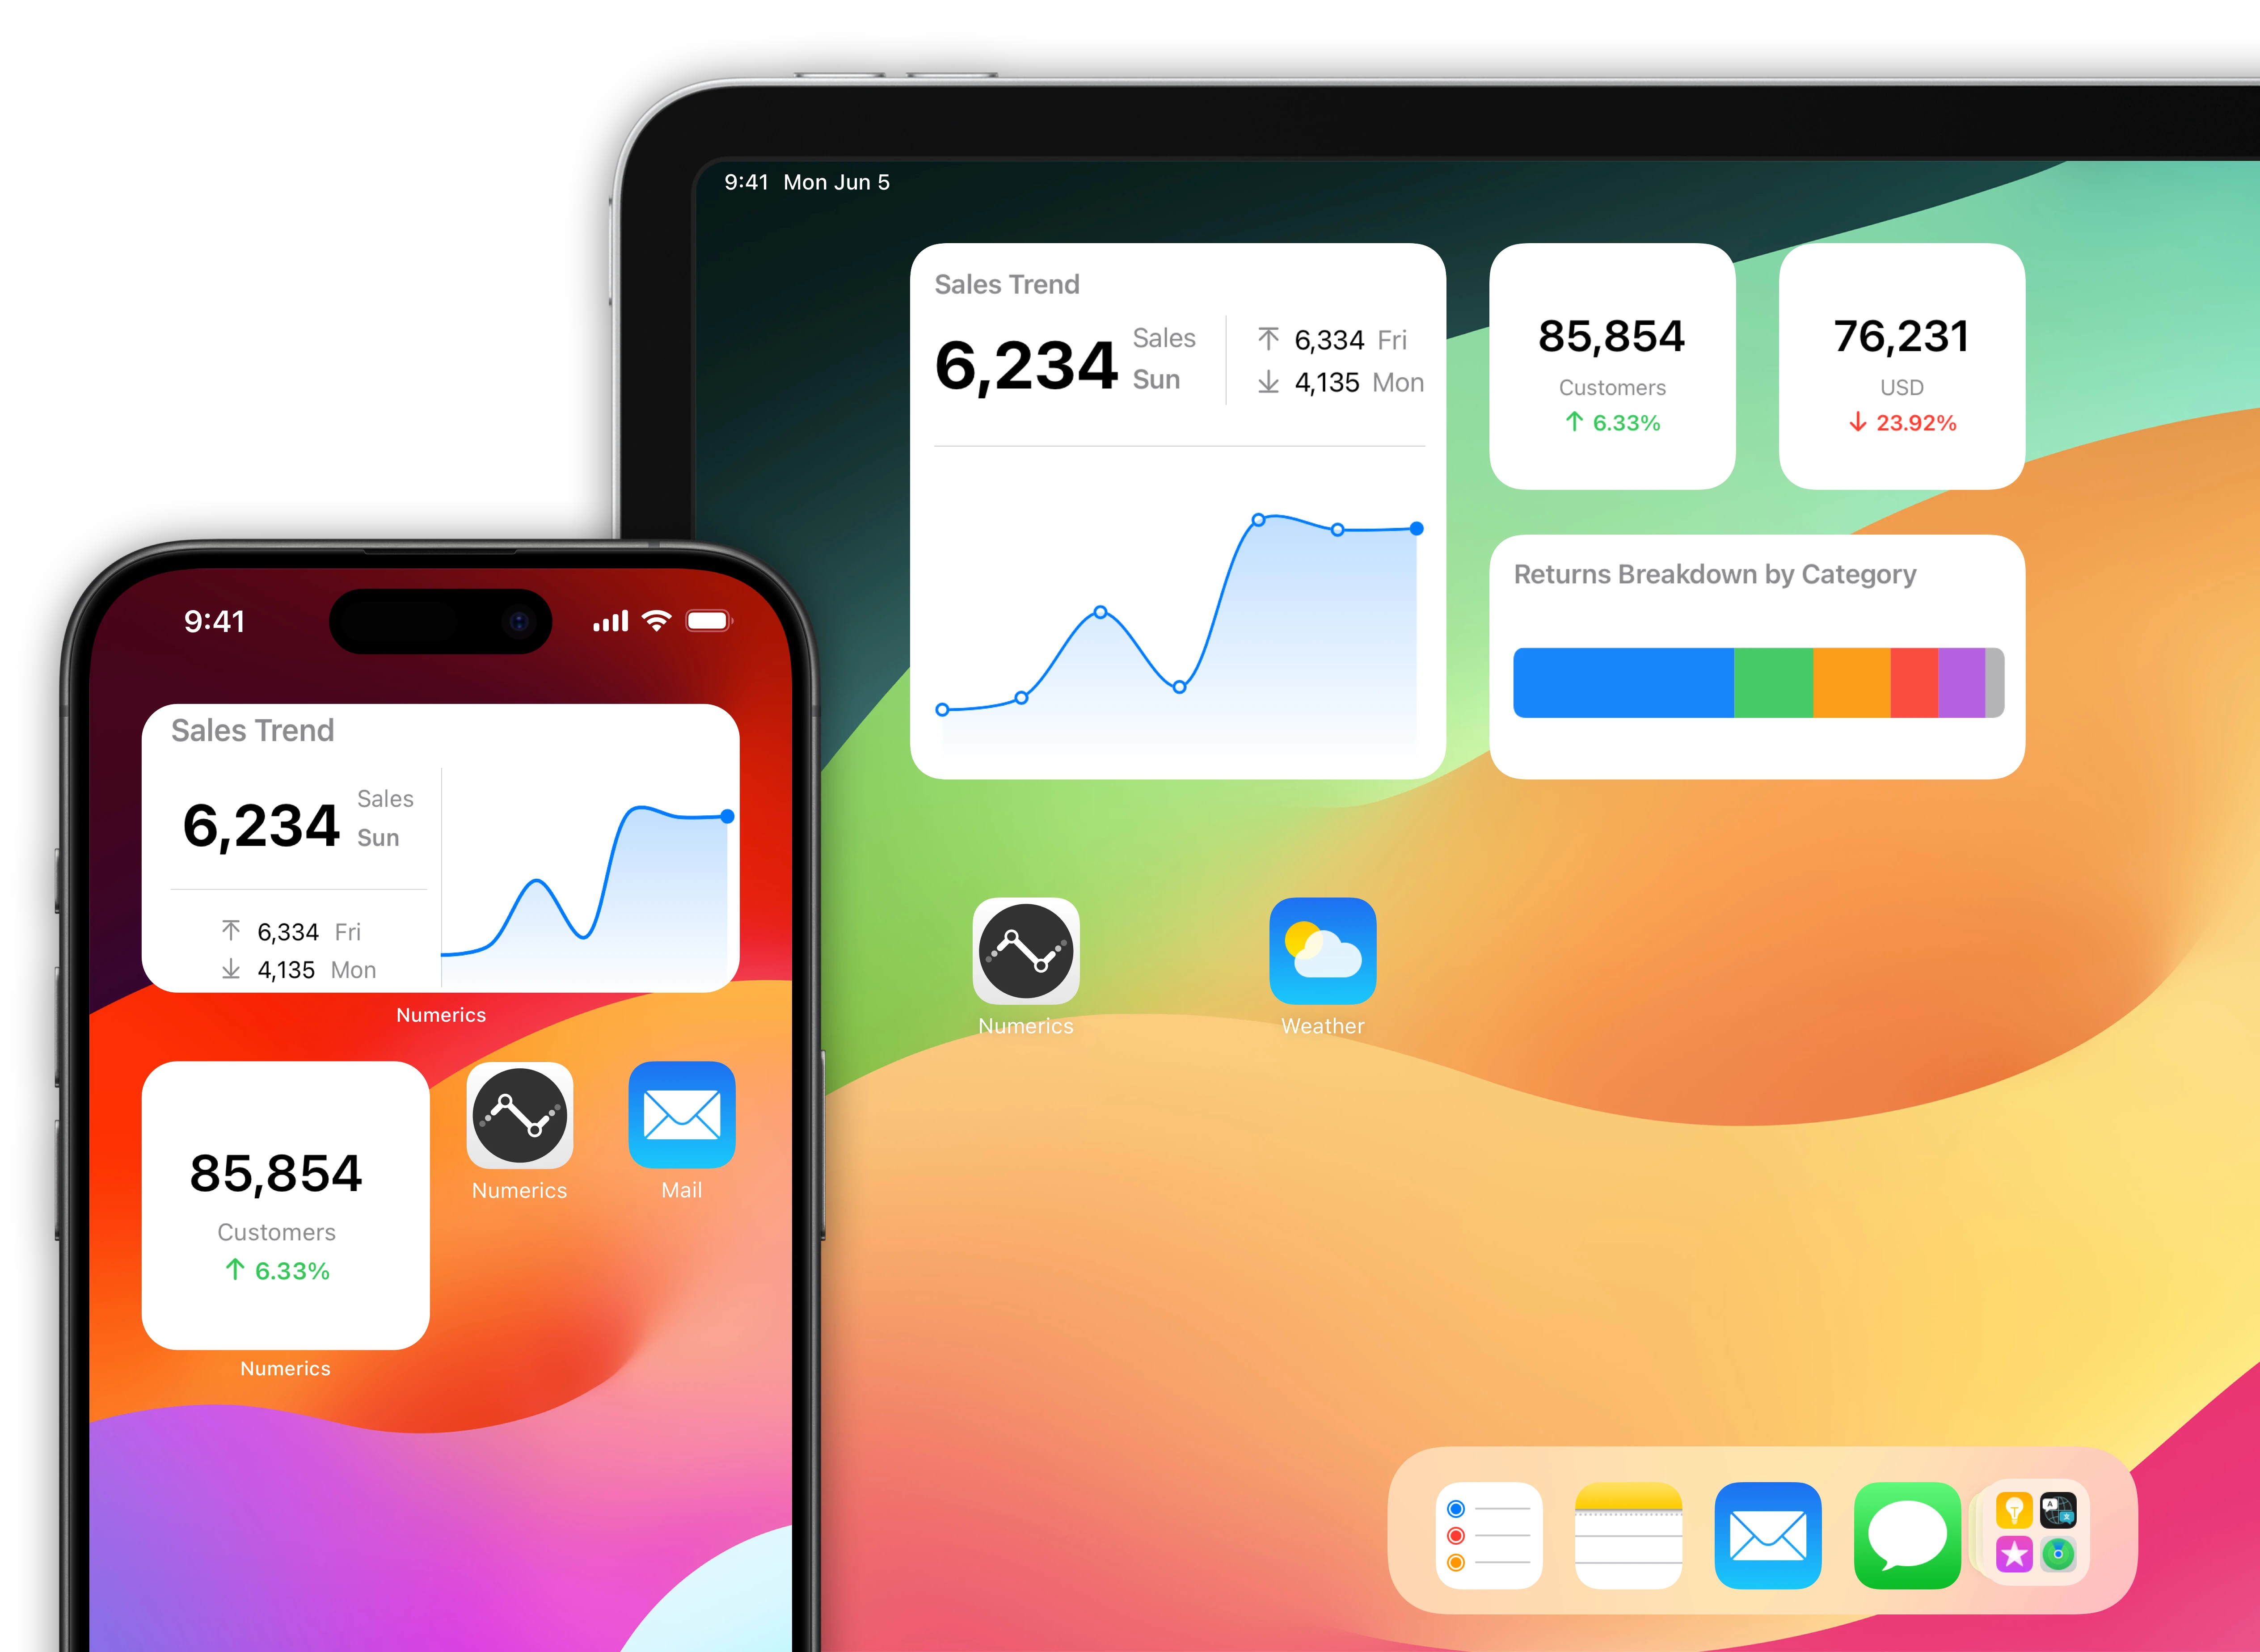
Pinterest Ads data driven home screens for your iOS Devices.

Native home screen widgets for your iPad & iPhone powered by data from your Pinterest Ads account.

A mini Pinterest Ads dashboard for your iOS home screen

Watch complications for your Apple Watch faces.

Design a custom marketing watch face using Pinterest Ads data.

Make Siri Pinterest Ads data aware!

“Hey Siri, what’s the engagement rate on my Pin?"

“Engagement rate for recent pin post is 74% with a value of 888,000 engagements out of 1.2M.”

Collaboratively build dashboards with teams in real-time

Stream & share Pinterest Ads KPIs with other users.

Stream a marketing dashboard to other Numerics users & co-create dashboards with your team in real-time via secure iCloud sharing & collaboration with Messages.

Related Documents:

Related Blog Posts:

Pinterest Ads Integration Specifications:

Pinterest Inc. Support:

Related Integrations

Foursquare Dashboards

Foursquare

Monitor changes in traffic to your venue with detailed engagement stats.

Instagram Dashboards

Instagram

Get the most out of your social media marketing with Instagram dashboards.

Youtube Dashboards

Youtube

Track and measure your YouTube channel performance and growth.

Get Numerics

The KPI dashboard app

Numerics icon-ws
Numerics icon-ws