

Conversation distribution by saved replies
The distribution of support conversations by the saved replies used for a specific mailbox within your chosen time span.
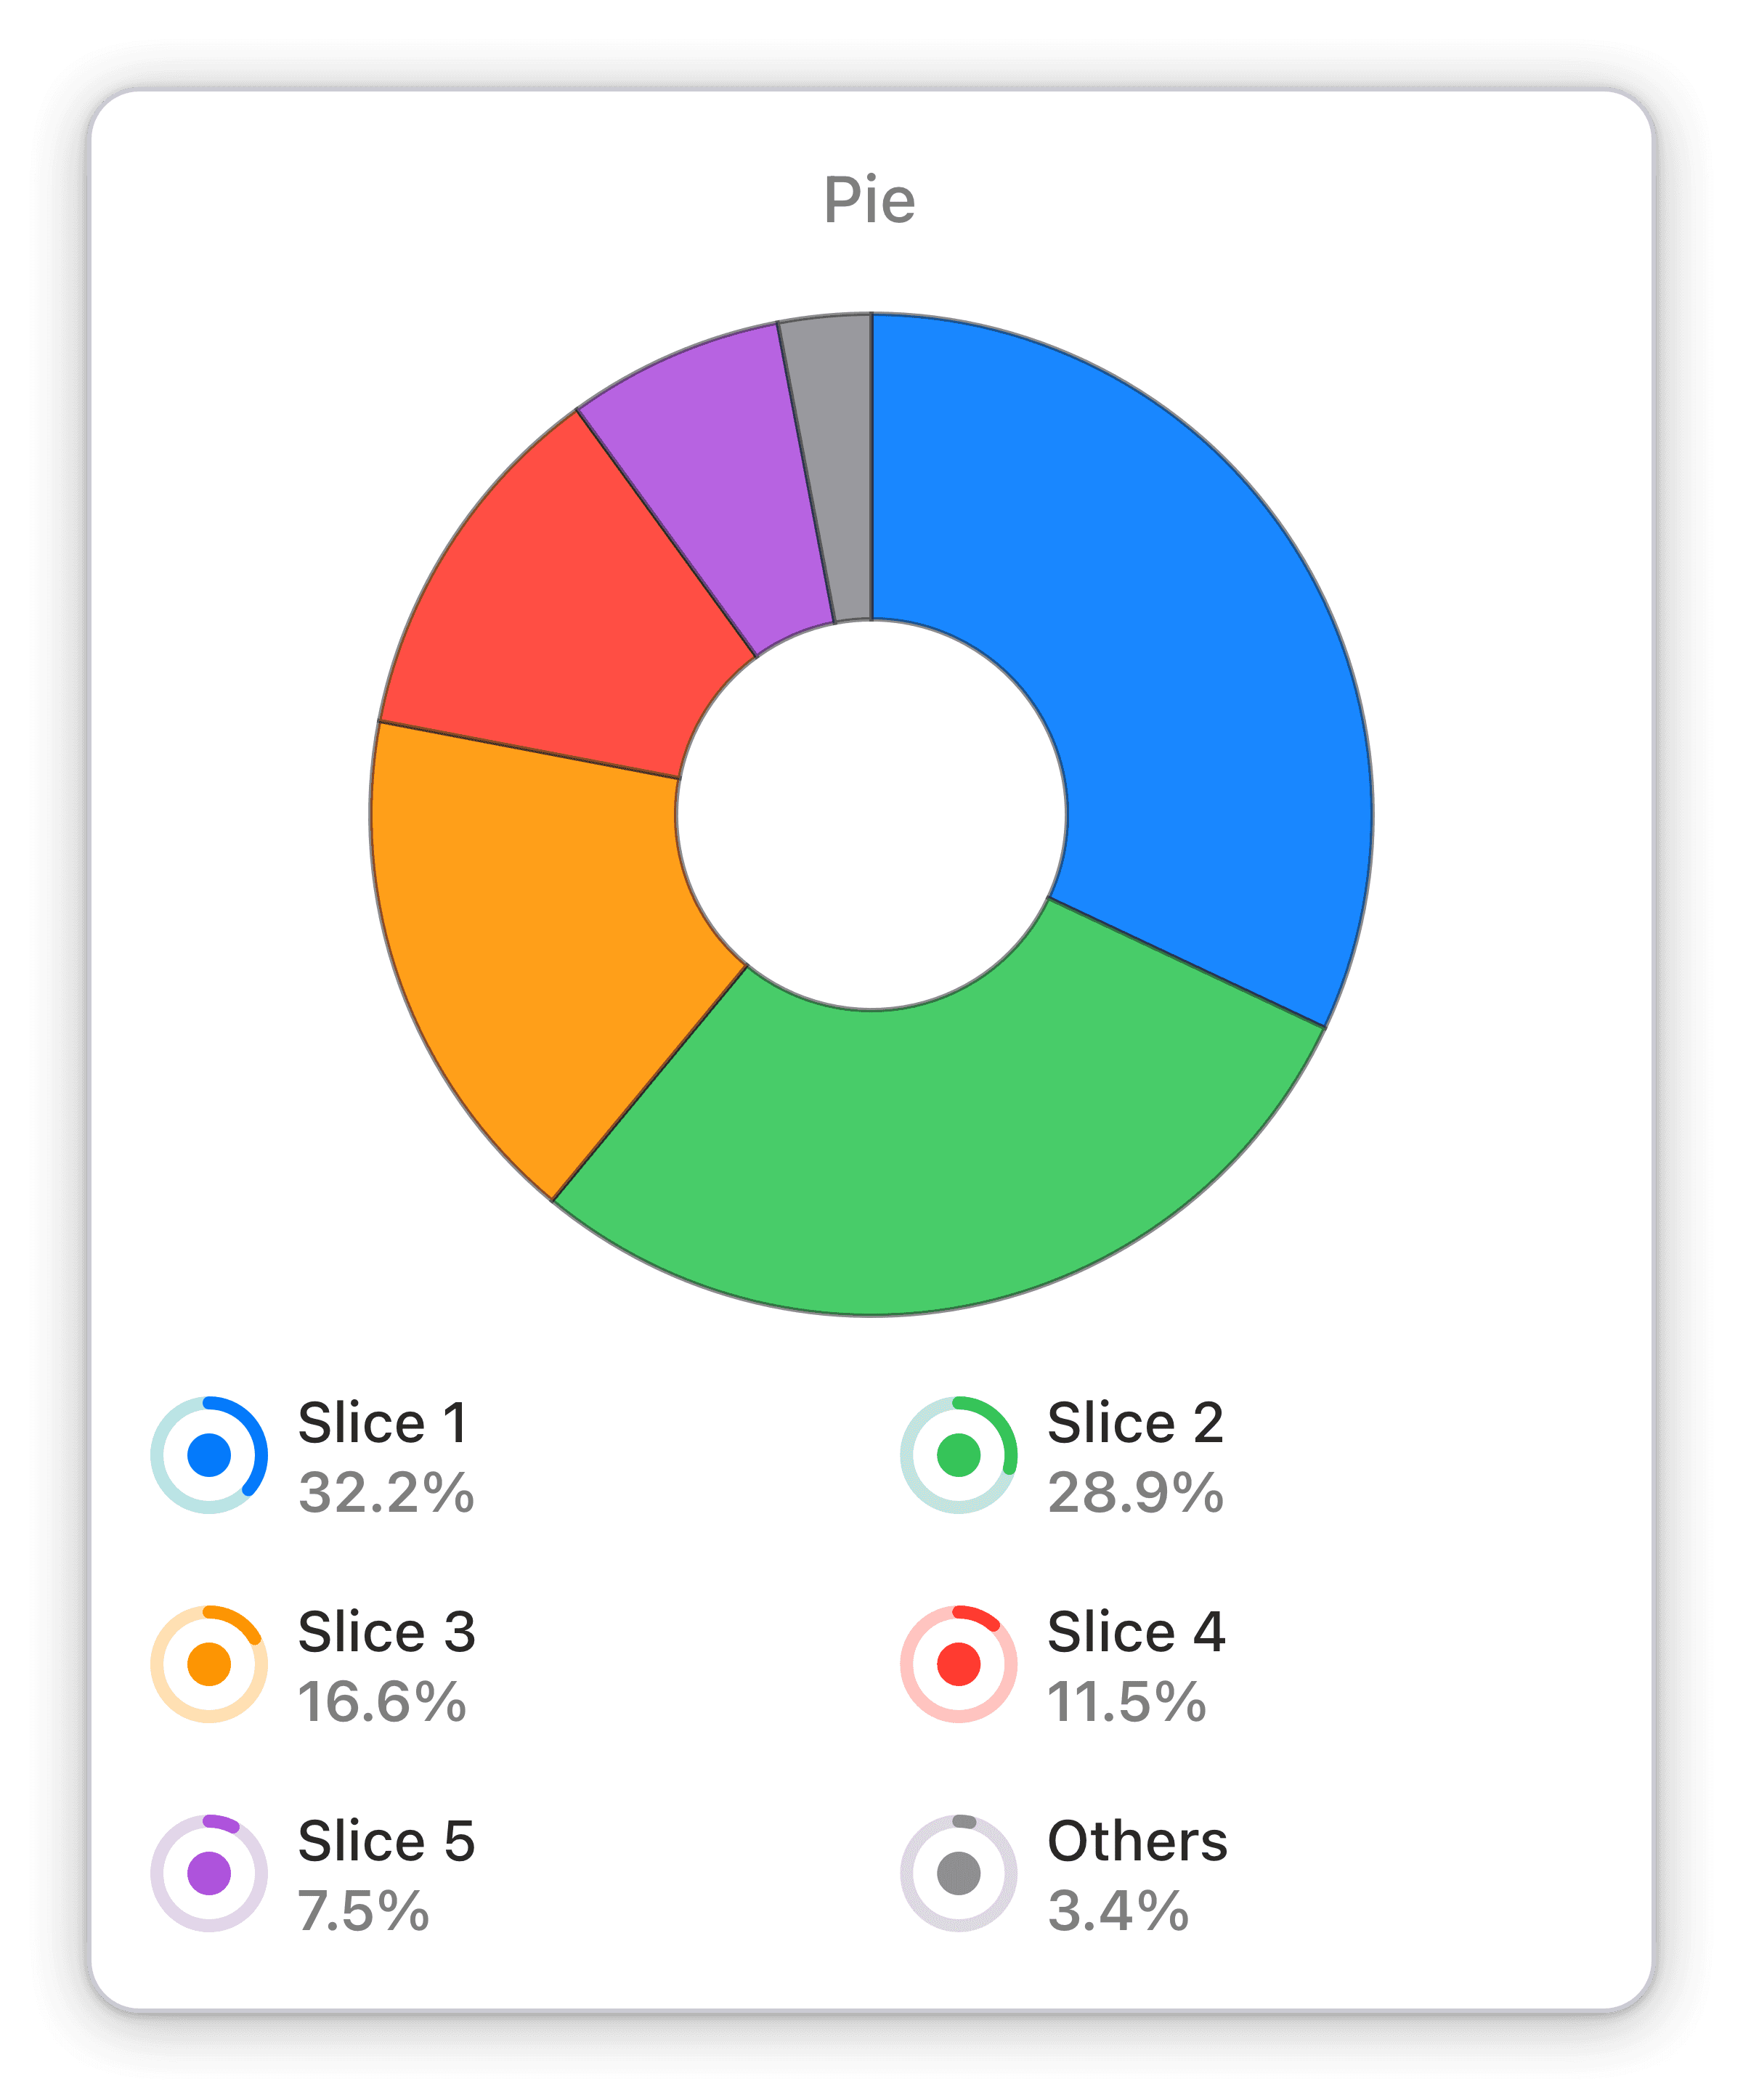
Visualize support conversation distribution by saved replies for a specific Help Scout mailbox with Numerics' Pie Chart widget.
The Conversation Distribution by Saved Replies widget is a Pie Chart that lets businesses visualize the distribution of support conversations by the saved replies used for a specific mailbox within their chosen time span. This widget provides real-time insights and empowers businesses to make informed decisions in a timely manner. With Numerics, businesses can stay ahead of the curve by accessing real-time KPIs and leveraging data-driven decisions to gain a competitive edge.
Benefits of Tracking Conversation distribution by saved replies in Help Scout customer support dashboards
As a business owner, keeping track of support conversations and the saved replies used can be a daunting task. With Numerics' Conversation Distribution by Saved Replies widget, you can visualize the distribution of support conversations by the saved replies used for a specific mailbox within your chosen time span. This widget proves to be a valuable asset as it enables you to make data-driven decisions in real-time, giving you an edge over the competition. With Numerics, you can stay ahead of the game by having access to real-time KPIs and making informed decisions in a timely manner.
Full Integration Details:
Part of the help scout
Conversation By Mailbox Widget Pack
Connect to your Help Scout data to build dashboards that track KPIs and metrics for a mailbox in real time.
More Help Scout Widget Packs:


Help Scout Integration Specifications:
Widget Templates:
147
Authentication Type:
OAuth
Supported plans:
All
API Rate limit:
10 Requests every 5 seconds


