


Updated
Ontraport Dashboard
Track & share your Ontraport KPIs in real-time with the Numerics dashboard app for your iPhone, iPad, Mac, Apple TV and Apple Watch.
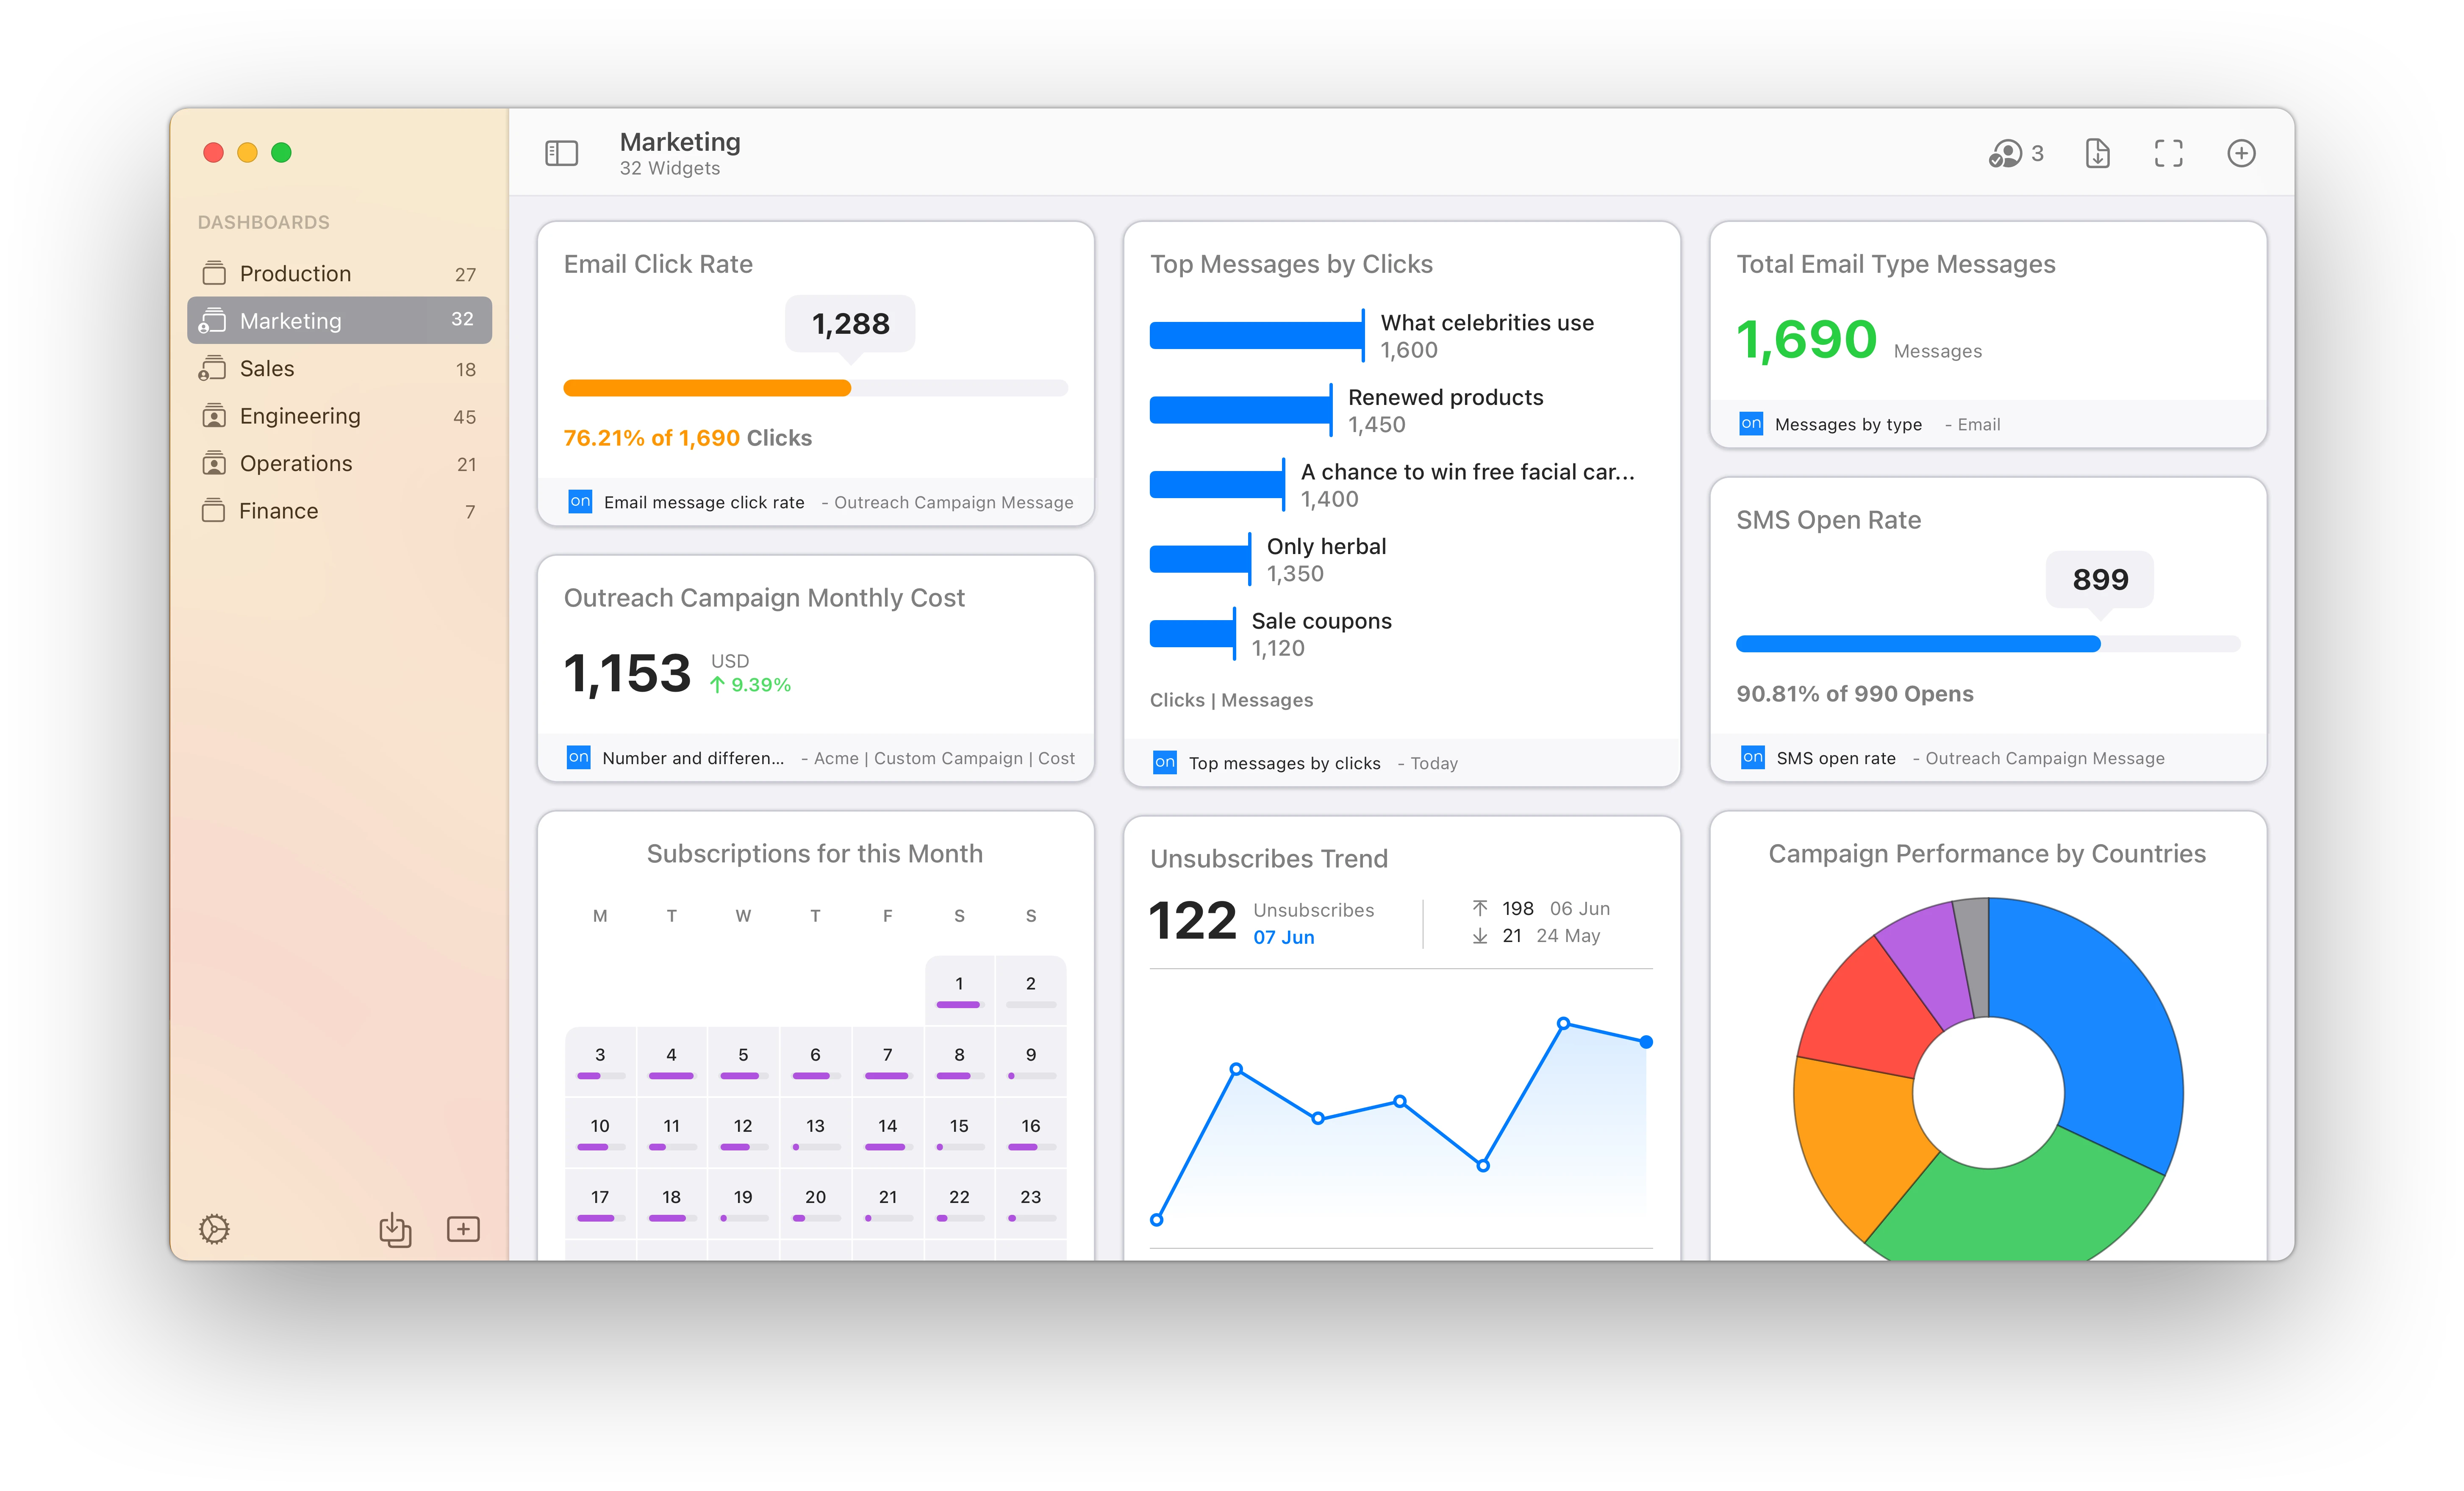
Numerics integrates with Ontraport to let you create dashboards that visualize your contacts, messages, and sales. It also lets you combine business metrics from Ontraport, Pipedrive, Google Analytics, Google Sheets & a variety of tools in your tech stack - into a unified, marketing dashboard that is glanceable and easy to understand.
With Numerics, you never lose sight of how your contacts, messages, and sales are performing. Now focus on the KPIs that matter most and make data-driven decisions anywhere, every time!

Ontraport is a CRM and automation platform designed for any business that’s ready to scale, giving you all the tools you need for selling, marketing and managing a business online — in one app.
58
Pre-built Ontraport KPI Templates.
Easy-to-use widget templates that serve as the building blocks to customizing your Ontraport dashboard.
58
Pre-built Ontraport KPI Templates.
Easy-to-use widget templates that serve as the building blocks to customizing your Ontraport dashboard.
Easy custom sales and marketing dashboard design.
Connect with your Ontraport account and create your own dashboards in minutes. No coding or training is required.
Easy custom sales and marketing dashboard design.
Connect with your Ontraport account and create your own dashboards in minutes. No coding or training is required.
Easy custom sales and marketing dashboard design.
Connect with your Ontraport account and create your own dashboards in minutes. No coding or training is required.
Secure, direct device-to-Ontraport connections.
The only Ontraport Dashboard tool on the planet that does not replicate your data and connects to the Ontraport servers directly from your devices. No intermediary cloud servers, secure by design.
Secure, direct device-to-Ontraport connections.
The only Ontraport Dashboard tool on the planet that does not replicate your data and connects to the Ontraport servers directly from your devices. No intermediary cloud servers, secure by design.
Secure, direct device-to-Ontraport connections.
The only Ontraport Dashboard tool on the planet that does not replicate your data and connects to the Ontraport servers directly from your devices. No intermediary cloud servers, secure by design.
KPIs & Key Metrics for Ontraport Dashboards
Build live sales and marketing dashboards using the pre-designed Ontraport dashboard widgets or KPI templates listed below.
Contacts

Pages

Tasks
Sales

Messages
Purchases
Custom Objects


A Native Ontraport Dashboard App for all your Apple devices


Ontraport Metrics Everywhere!
Have your KPIs & metrics break out of your sales and marketing dashboard app into other parts of your devices.
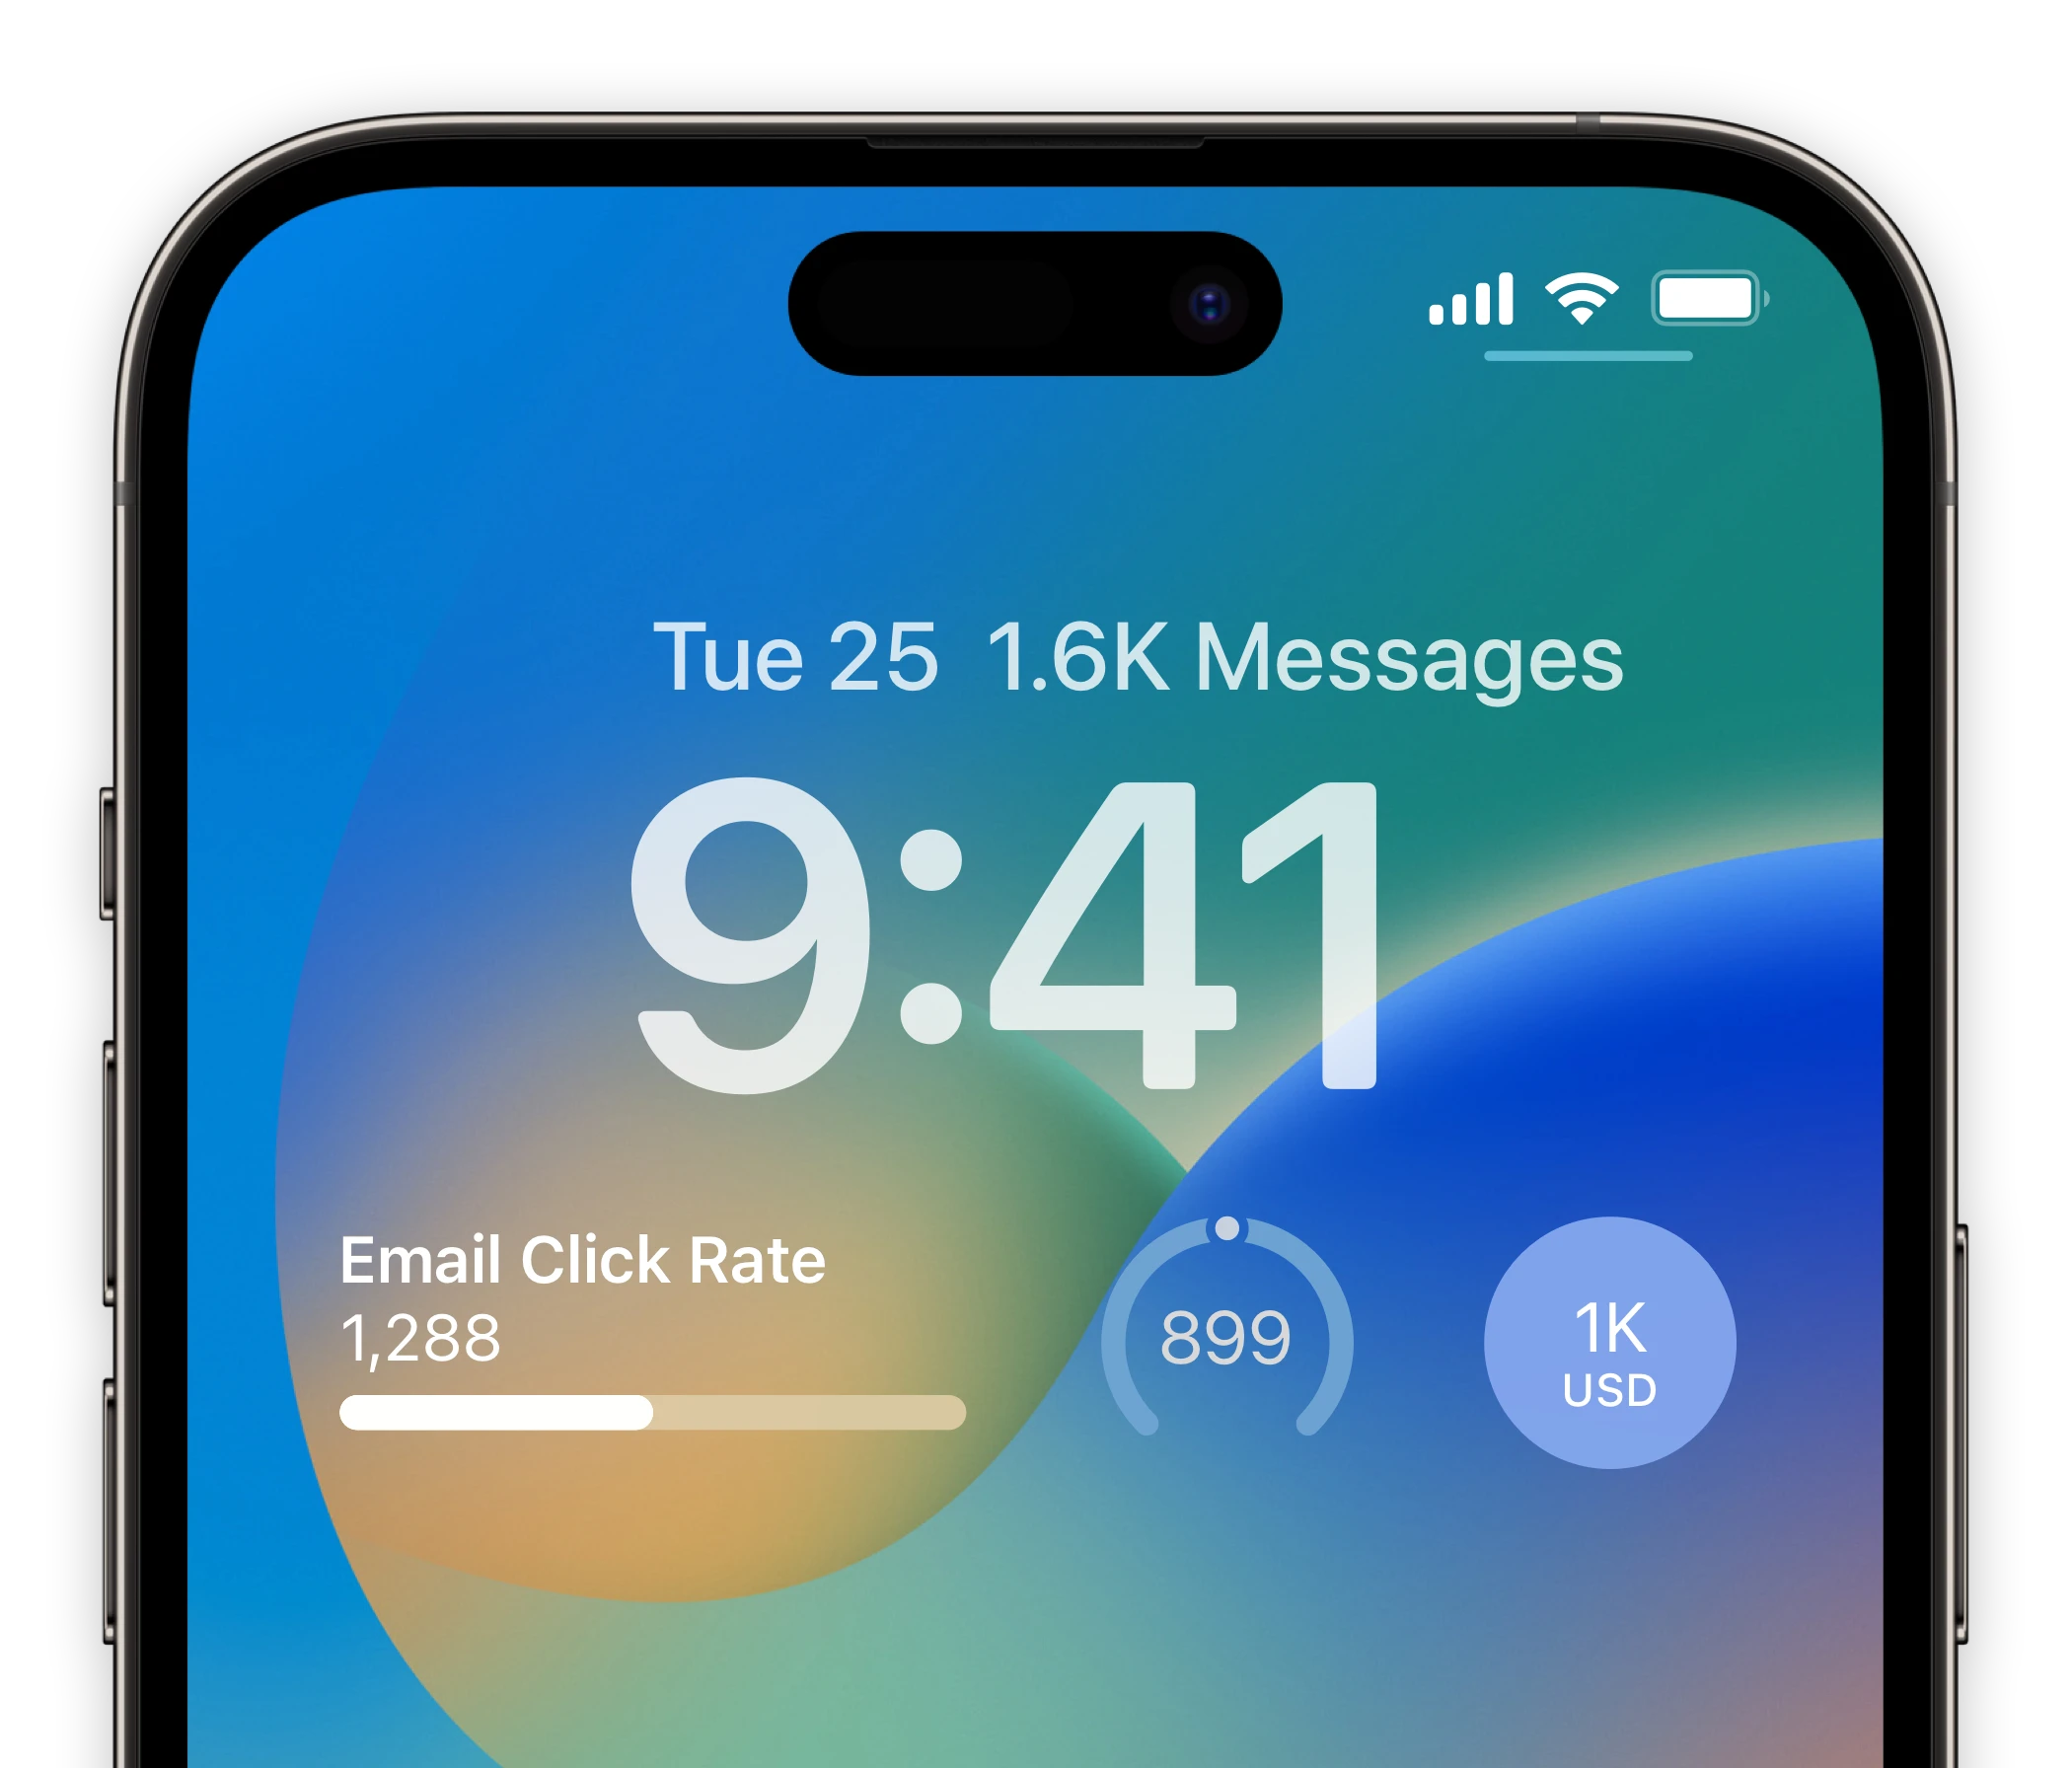
Lock-screen widgets on your iPhone.
Keep track of your most important sales and marketing metrics of Ontraport right from your iPhone lock screen.
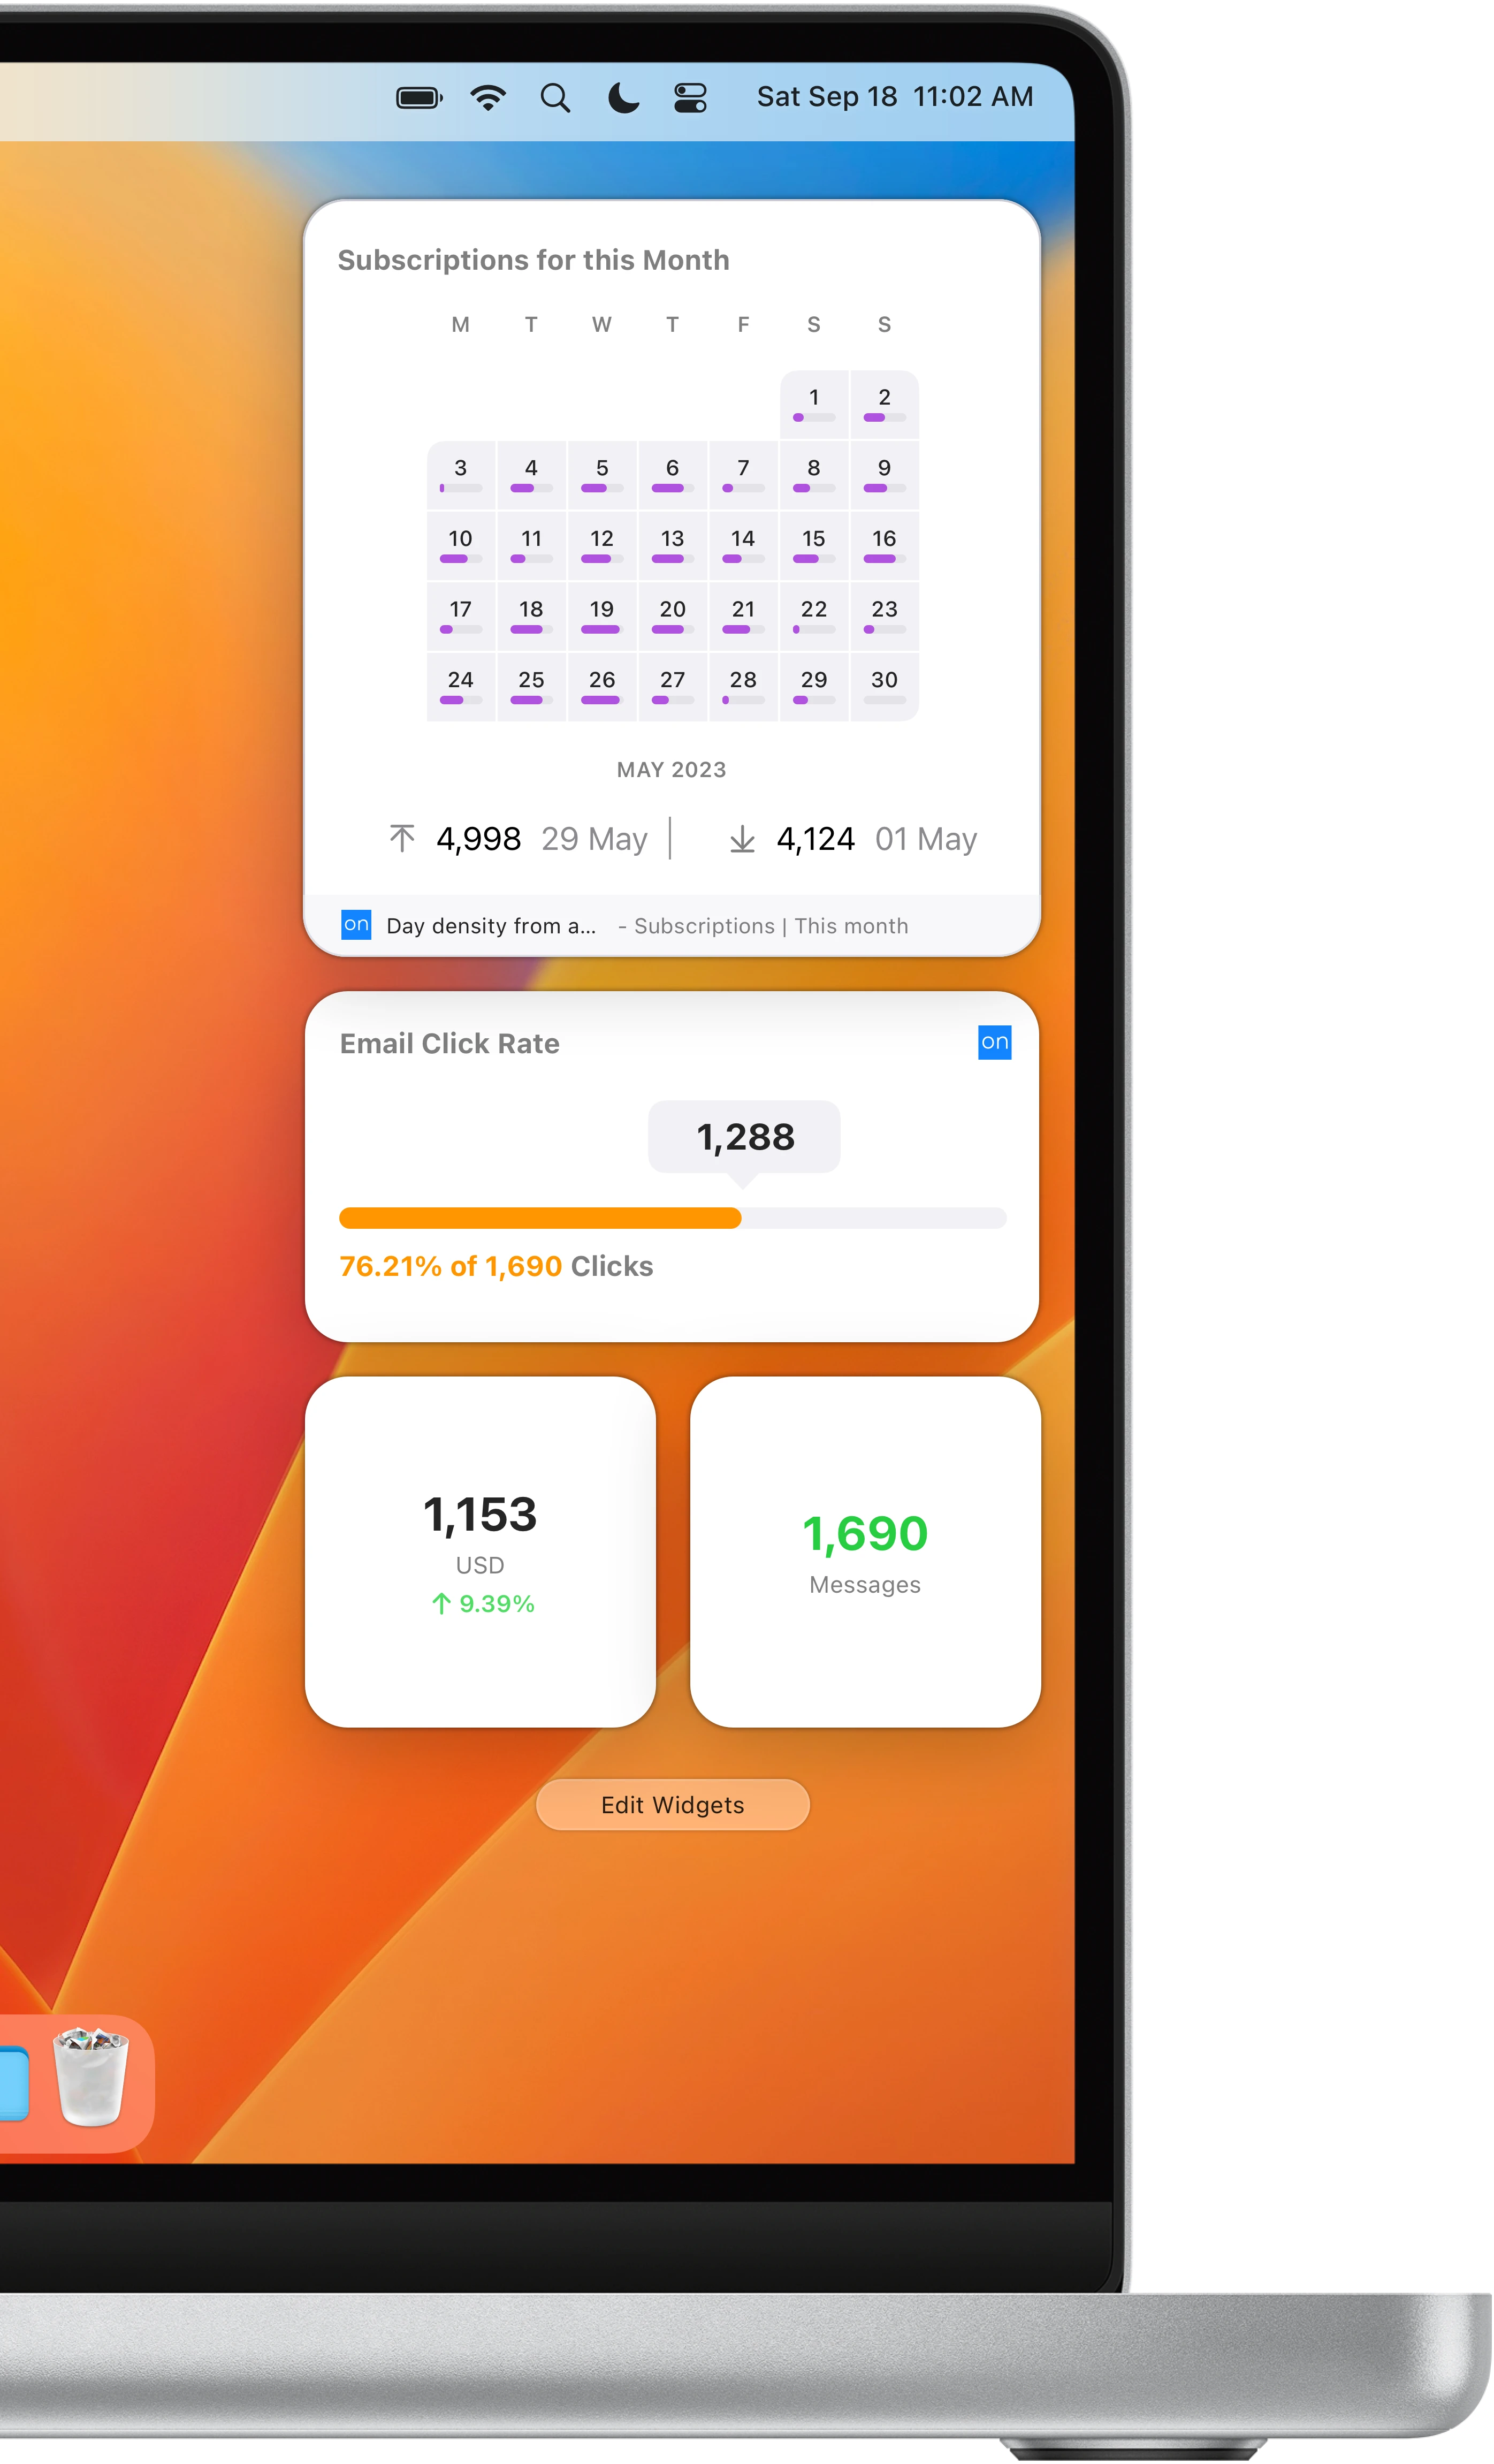
Notification center widgets for your Mac.
Connect your Ontraport metrics to your MacOS sidebar.
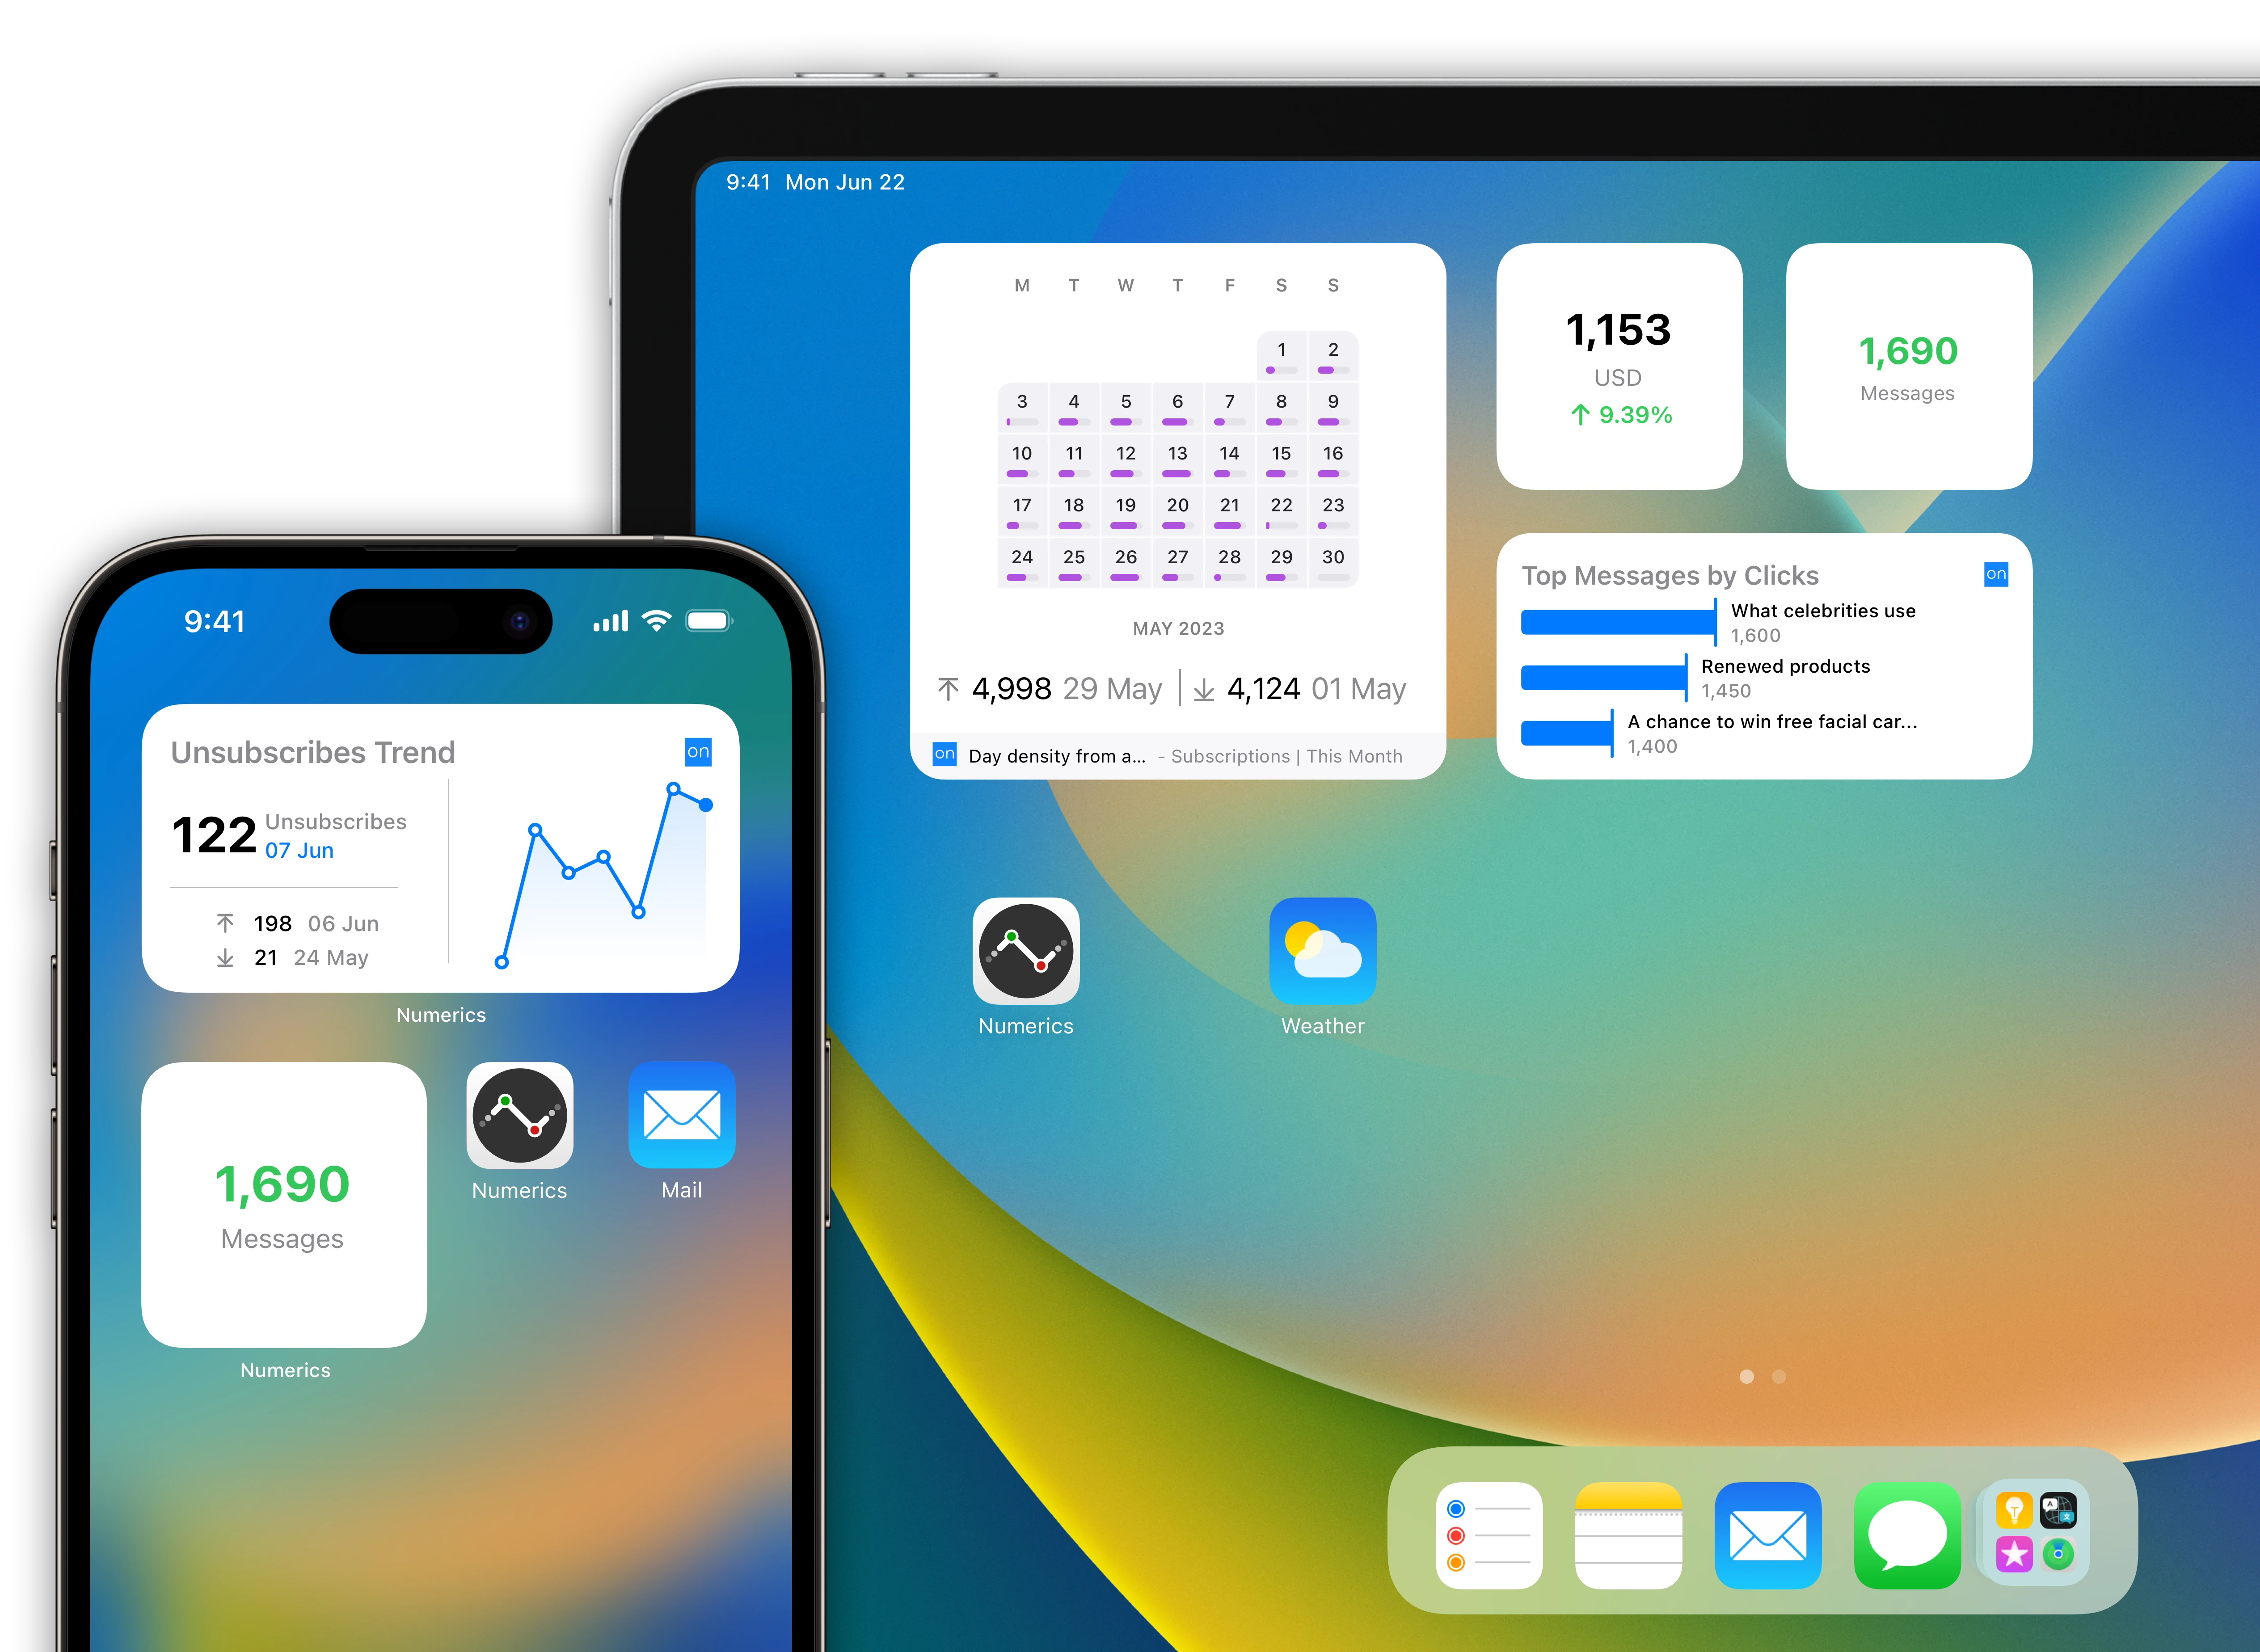
Ontraport data driven home screens for your iOS Devices.
Native home screen widgets for your iPad & iPhone powered by data from your Ontraport account.
Watch complications for your Apple Watch faces.
Design a custom sales and marketing watch face using Ontraport data.

Make Siri Ontraport data aware!
"Hey Siri, what's the status of top sources by sales?"
Subscription Sales with USD 29450 is the top source for Top Sources by Sales

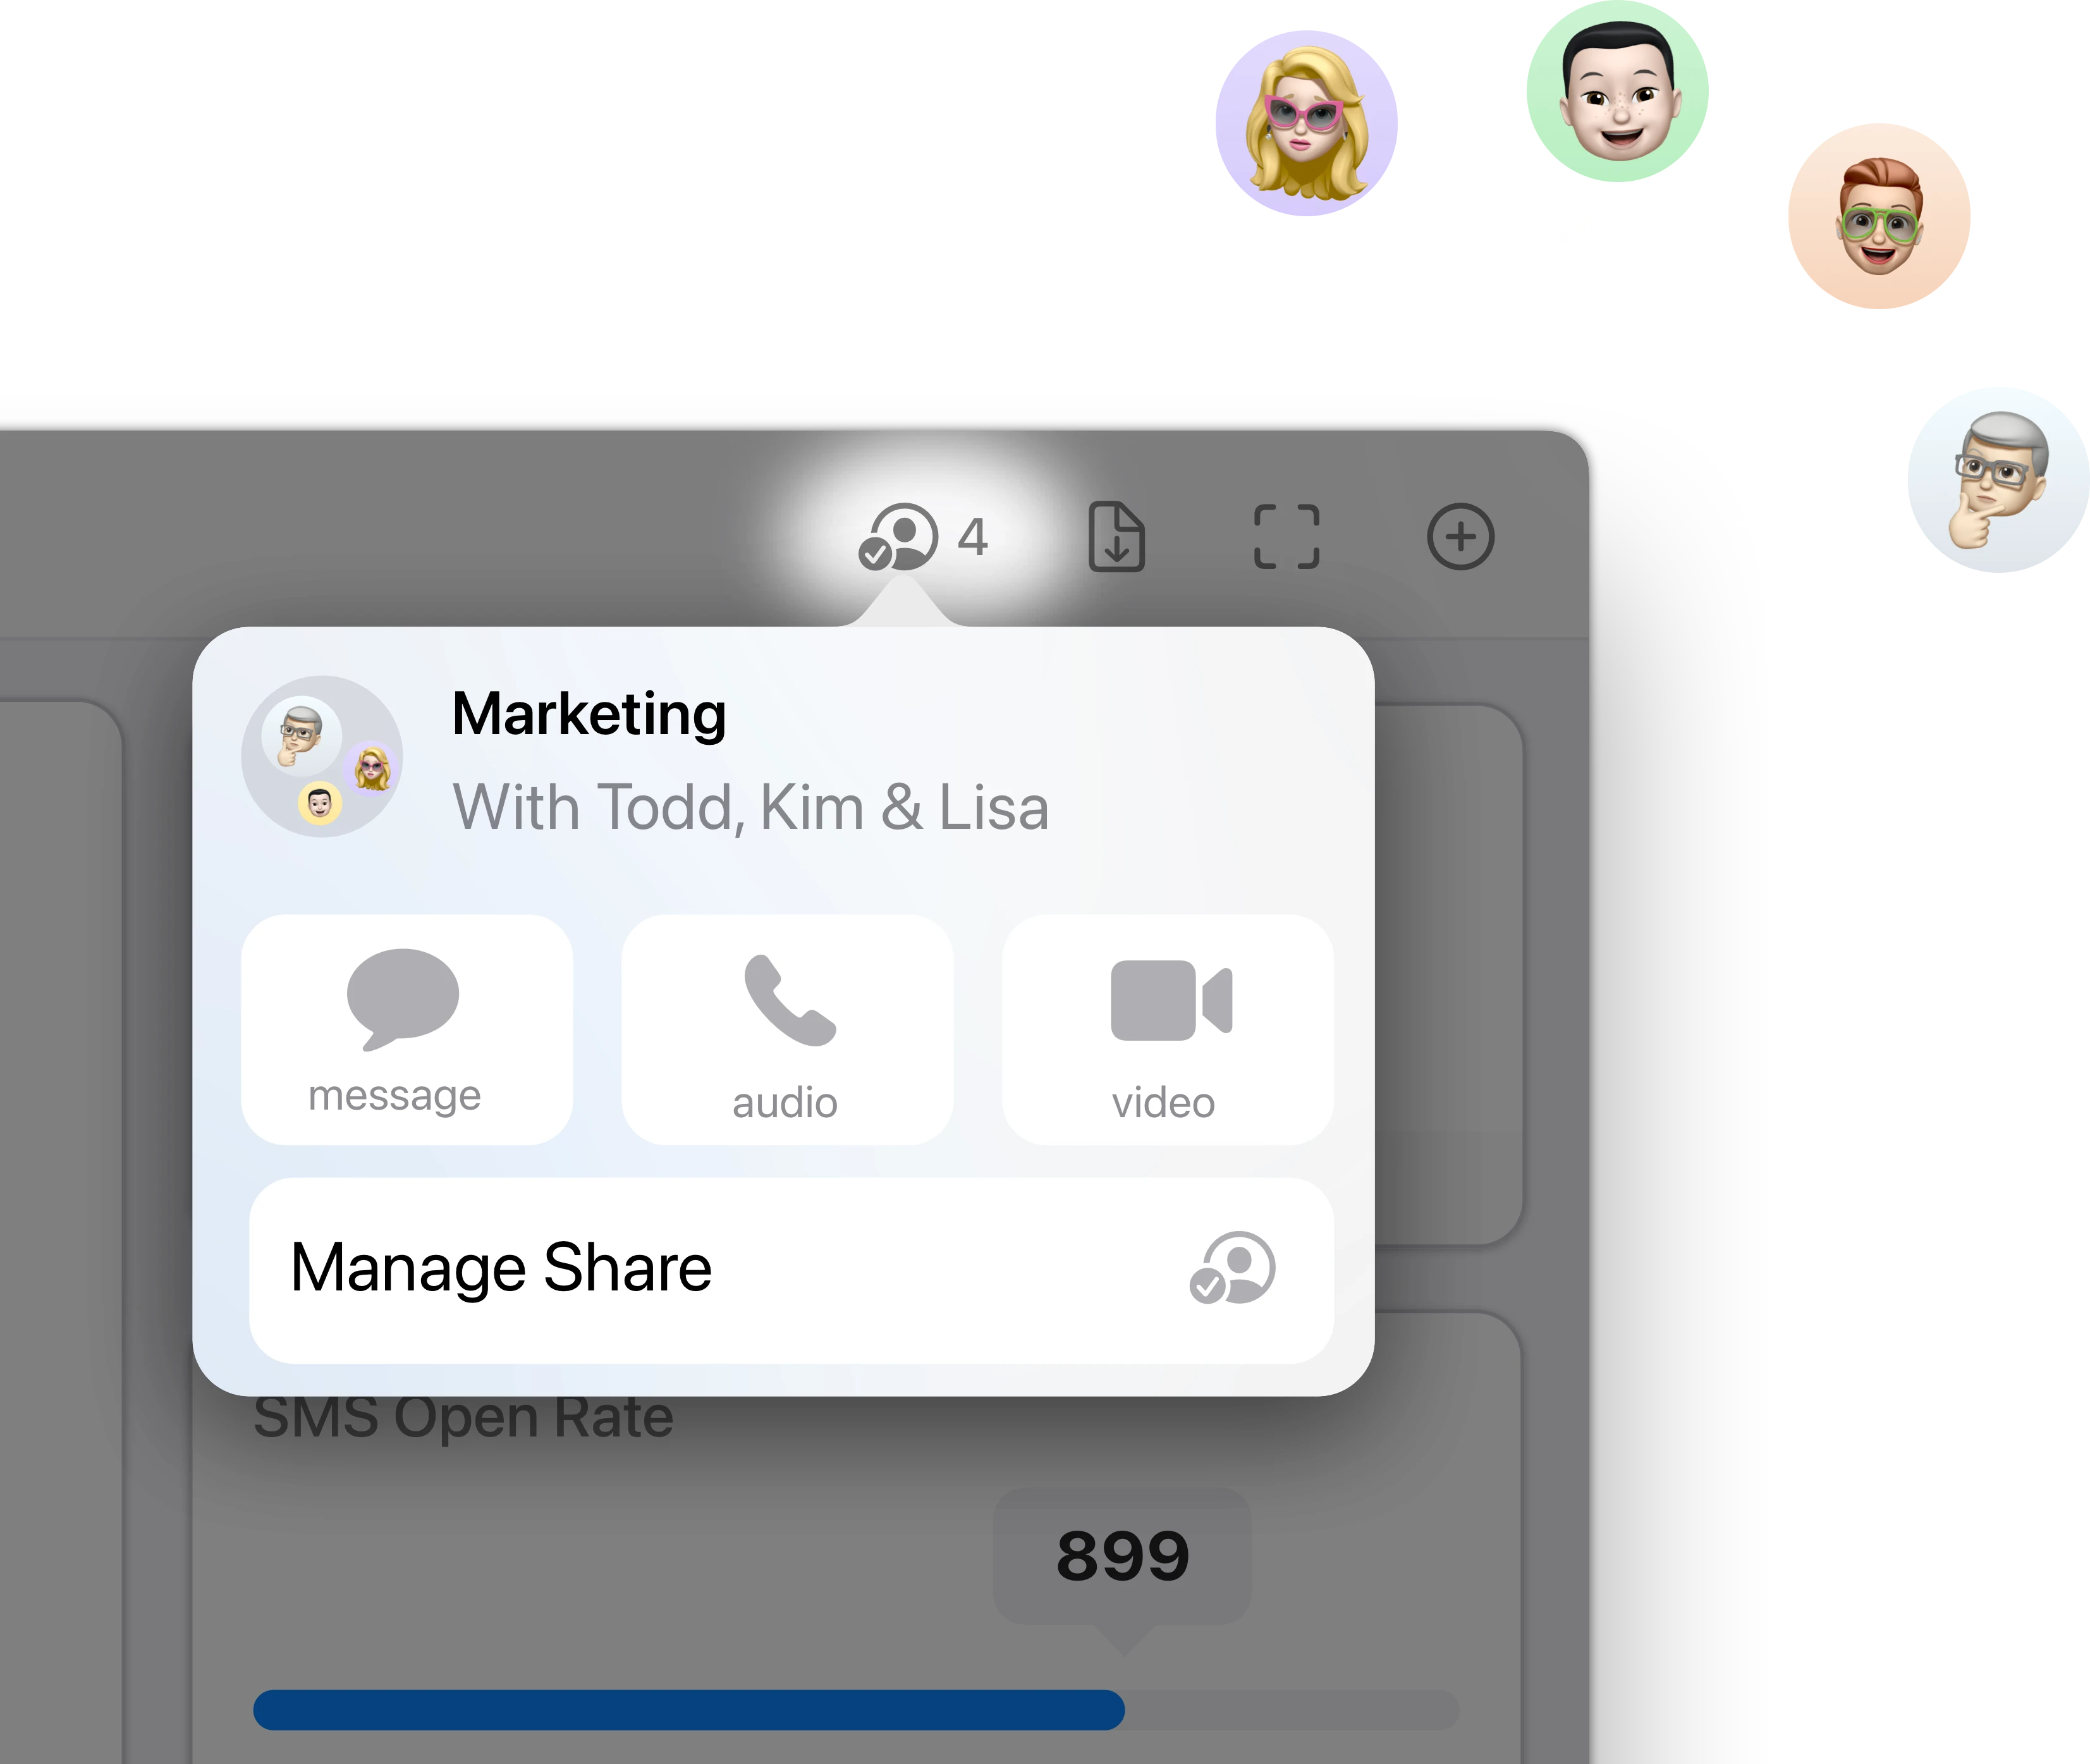
Stream & share Ontraport KPIs with other users.
Stream a sales and marketing dashboard to other Numerics users & co-create dashboards with your team in real-time via secure iCloud sharing & collaboration with Messages.
Related Documents:

Related Blog Posts:

Ontraport Integration Specifications:
Widget Templates:
58
Authentication Type:
Token based auth
Supported plans:
All
API Rate limit:
180 Requests every mminute
Ontraport Integration Specifications:
Widget Templates:
58
Authentication Type:
Token based auth
Supported plans:
All
API Rate limit:
180 Requests every mminute
Ontraport Integration Specifications:
Widget Templates:
58
Authentication Type:
Token based auth
Supported plans:
All
API Rate limit:
180 Requests every mminute
Related Integrations


Users ❤️ Numerics
Users ❤️ Numerics
Customer Spotlight
Phil Steadman, VP of Operations - Ajax Mazda explains how they use Numerics across their 5 dealerships in Ontario, Canada.
Reviews from the App Store:
Reviews from the App Store:

A must for any small business owner!
Super simple set up, I'm getting data from many sources, and for the ones that are not supported, a Google Spreadsheet is used instead. Been using it happily for 2 years now.
Ade Theux
Switzerland
Just what I need!
I used this app throughout our "busy season" at work to great effect - everyone liked the sleek dashboard that I was able to show off. Looking forward to more updates.
FT Laudman
United States
A vital app for all businesses
I run a startup company and Numerics is vital for me to keep track of all business related statistics such as webpage analytics, Facebook and Twitter followers - even internal performance indicators from Google docs.
Tomas Ahlström
Sweden
Best ever!
Best dashboard app ever = fast, easy & affordable!
Zipfelmuetze
Switzerland
A dream come true!
This is an amazing app that cuts off front end development if you want to build a stats dashboard. The large list of services also makes it easier to connect to services that are already in use like Google Analytics and social media accounts.
Dezainr
United States
Absolutely love it
Highly recommended, super easy, and a good set of integrations. Alot of other dashboard solutions are too costly as a small business owner, this was the perfect fit.
Rod Alberta
Canada
A must for any small business owner!
Super simple set up, I'm getting data from many sources, and for the ones that are not supported, a Google Spreadsheet is used instead. Been using it happily for 2 years now.
Ade Theux
Switzerland
A dream come true!
This is an amazing app that cuts off front end development if you want to build a stats dashboard. The large list of services also makes it easier to connect to services that are already in use like Google Analytics and social media accounts.
Dezainr
United States
Best ever!
Best dashboard app ever = fast, easy & affordable!
Zipfelmuetze
Switzerland
A vital app for all businesses
I run a startup company and Numerics is vital for me to keep track of all business related statistics such as webpage analytics, Facebook and Twitter followers - even internal performance indicators from Google docs.
Tomas Ahlström
Sweden
Just what I need!
I used this app throughout our "busy season" at work to great effect - everyone liked the sleek dashboard that I was able to show off. Looking forward to more updates.
FT Laudman
United States
Absolutely love it
Highly recommended, super easy, and a good set of integrations. Alot of other dashboard solutions are too costly as a small business owner, this was the perfect fit.
Rod Alberta
Canada
A must for any small business owner!
Super simple set up, I'm getting data from many sources, and for the ones that are not supported, a Google Spreadsheet is used instead. Been using it happily for 2 years now.
Ade Theux
Switzerland
A vital app for all businesses
I run a startup company and Numerics is vital for me to keep track of all business related statistics such as webpage analytics, Facebook and Twitter followers - even internal performance indicators from Google docs.
Tomas Ahlström
Sweden
A dream come true!
This is an amazing app that cuts off front end development if you want to build a stats dashboard. The large list of services also makes it easier to connect to services that are already in use like Google Analytics and social media accounts.
Dezainr
United States
Just what I need!
I used this app throughout our "busy season" at work to great effect - everyone liked the sleek dashboard that I was able to show off. Looking forward to more updates.
FT Laudman
United States
Best ever!
Best dashboard app ever = fast, easy & affordable!
Zipfelmuetze
Switzerland
Absolutely love it
Highly recommended, super easy, and a good set of integrations. Alot of other dashboard solutions are too costly as a small business owner, this was the perfect fit.
Rod Alberta
Canada
Get Numerics
Get started with your custom KPI dashboards for FREE!


Get Numerics
Get started with your custom KPI dashboards for FREE!

Get Numerics
Get started with your custom KPI dashboards for FREE!