


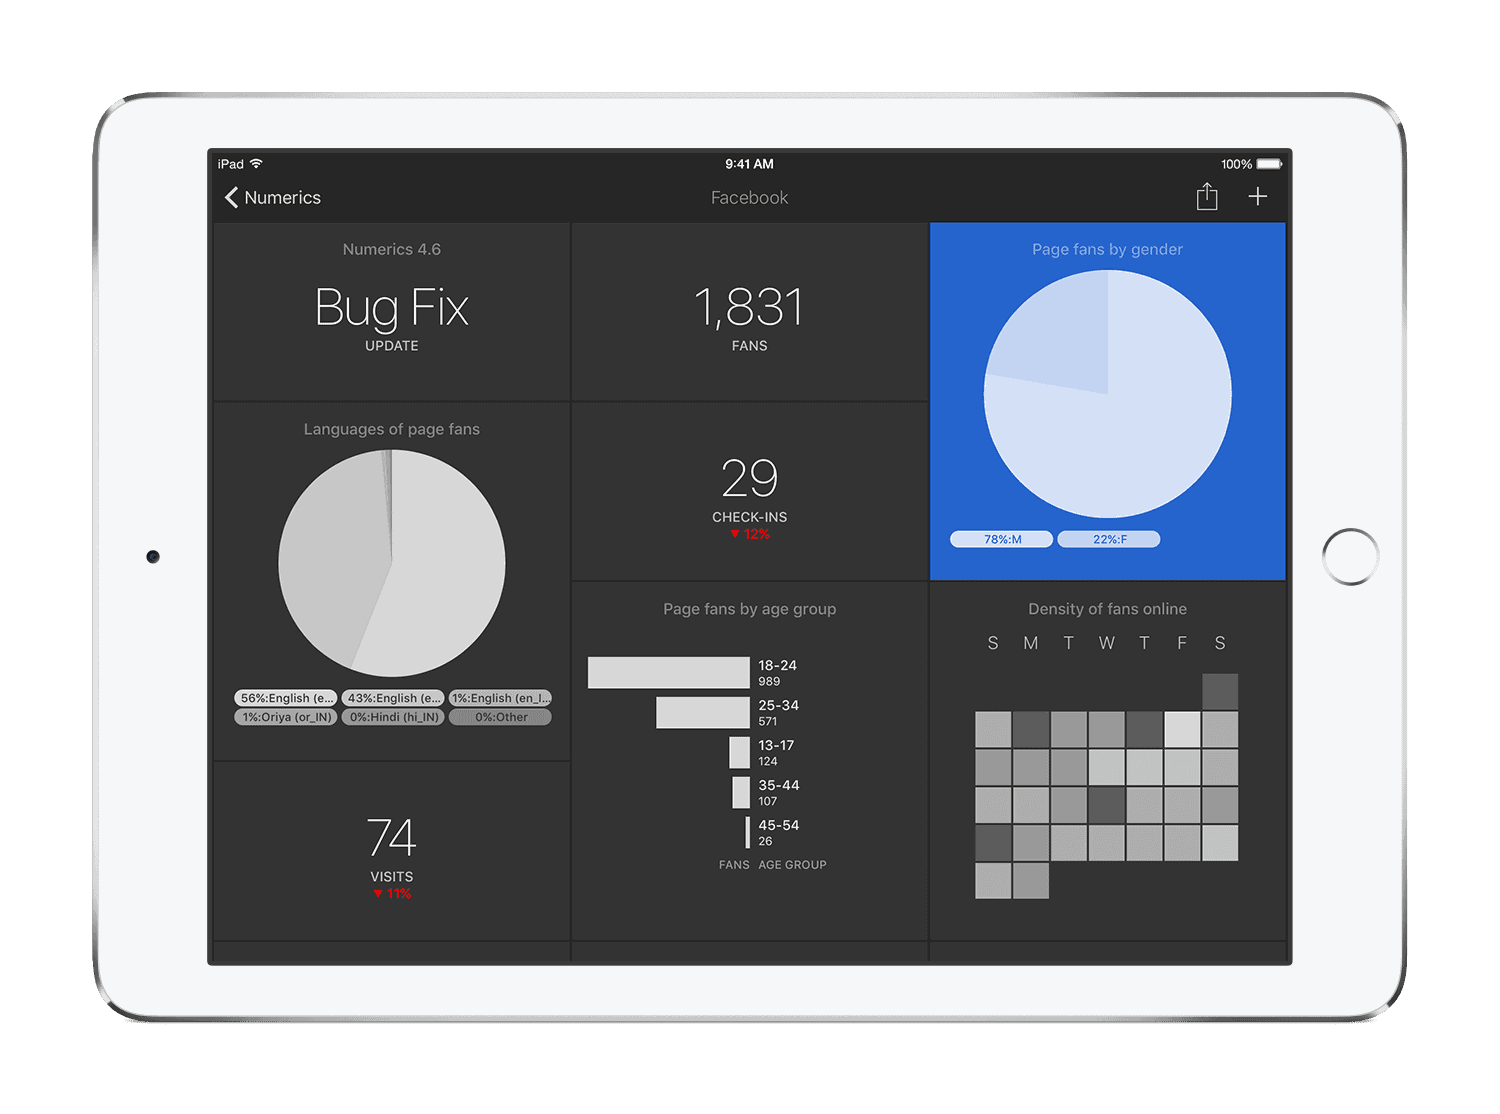
Facebook Dashboard
Track & share your Facebook KPIs in real-time with the Numerics dashboard app for your iPhone, iPad, Mac, Apple TV and Apple Watch.
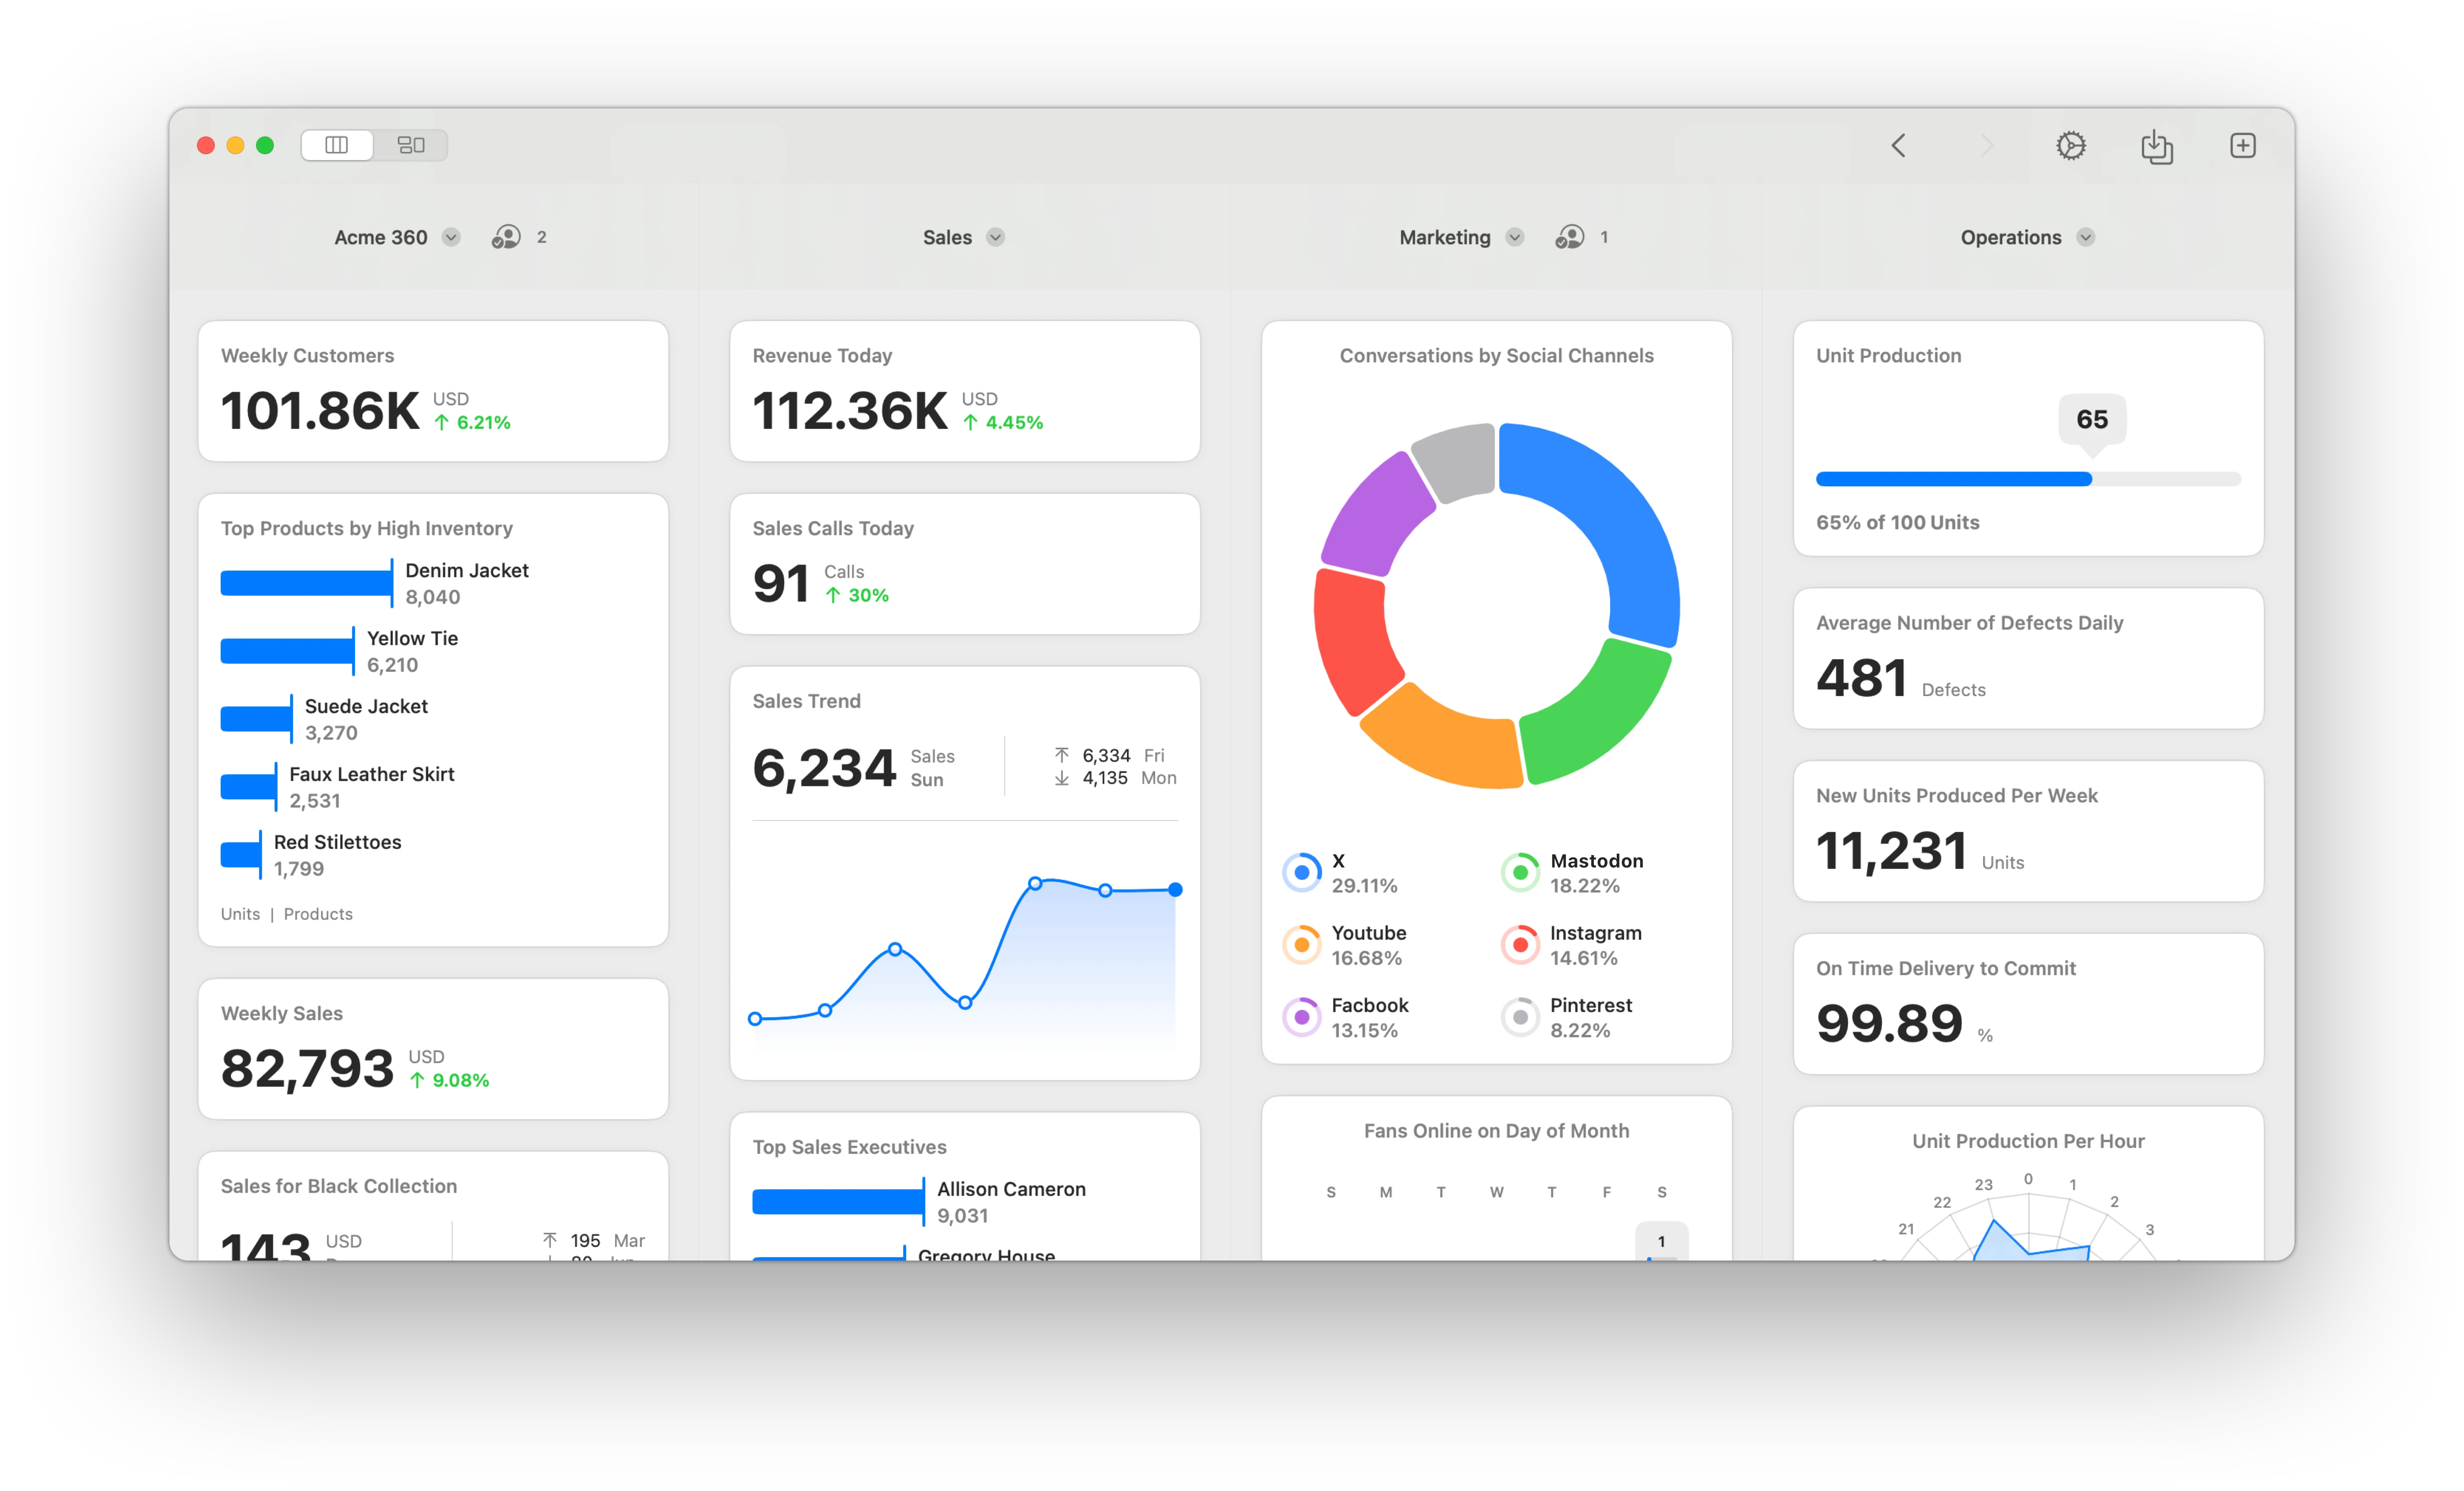
Numerics integrates with Facebook to let you create dashboards to help businesses and organizations monitor and analyze their performance on the platform. With Numerics integration, businesses can access key metrics such as the number of page fans, page/post engagements as well as track their performance over time. It also lets you combine business metrics from Facebook Ads, Pinterest Ads, Google Analytics, Twitter, Instagram & a variety of tools in your tech stack - into a unified, marketing dashboard that is glanceable and easy to understand.
Numerics provides an easy-to-use interface that combines data from Facebook with other sources, making it an effective tool for managing and growing a brand's presence on the platform.

Facebook is the largest social network that helps businesses reach their goals by providing a platform to promote it to relevant audiences.
95
Pre-built Facebook KPI Templates.
Easy-to-use widget templates that serve as the building blocks to customizing your Facebook dashboard.
95
Pre-built Facebook KPI Templates.
Easy-to-use widget templates that serve as the building blocks to customizing your Facebook dashboard.
Easy custom marketing dashboard design.
Connect with your Facebook account and create your own dashboards in minutes. No coding or training is required.
Easy custom marketing dashboard design.
Connect with your Facebook account and create your own dashboards in minutes. No coding or training is required.
Easy custom marketing dashboard design.
Connect with your Facebook account and create your own dashboards in minutes. No coding or training is required.
Secure, direct device-to-Facebook connections.
The only Facebook Dashboard tool on the planet that does not replicate your data and connects to the Facebook servers directly from your devices. No intermediary cloud servers, secure by design.
Secure, direct device-to-Facebook connections.
The only Facebook Dashboard tool on the planet that does not replicate your data and connects to the Facebook servers directly from your devices. No intermediary cloud servers, secure by design.
Secure, direct device-to-Facebook connections.
The only Facebook Dashboard tool on the planet that does not replicate your data and connects to the Facebook servers directly from your devices. No intermediary cloud servers, secure by design.
KPIs & Key Metrics for Facebook Dashboards
Build live marketing dashboards using the pre-designed Facebook dashboard widgets or KPI templates listed below.
Page User Demographics


Page Visits


Page Action Clicks
Page Engagement
Page Impressions
Page Reactions
Page Post Impressions
Post Impressions
Post Engagement
Post Reactions

Stories
Video Views
A Native Facebook Dashboard App for all your Apple devices
Facebook Metrics Everywhere!
Have your KPIs & metrics break out of your marketing dashboard app into other parts of your devices.
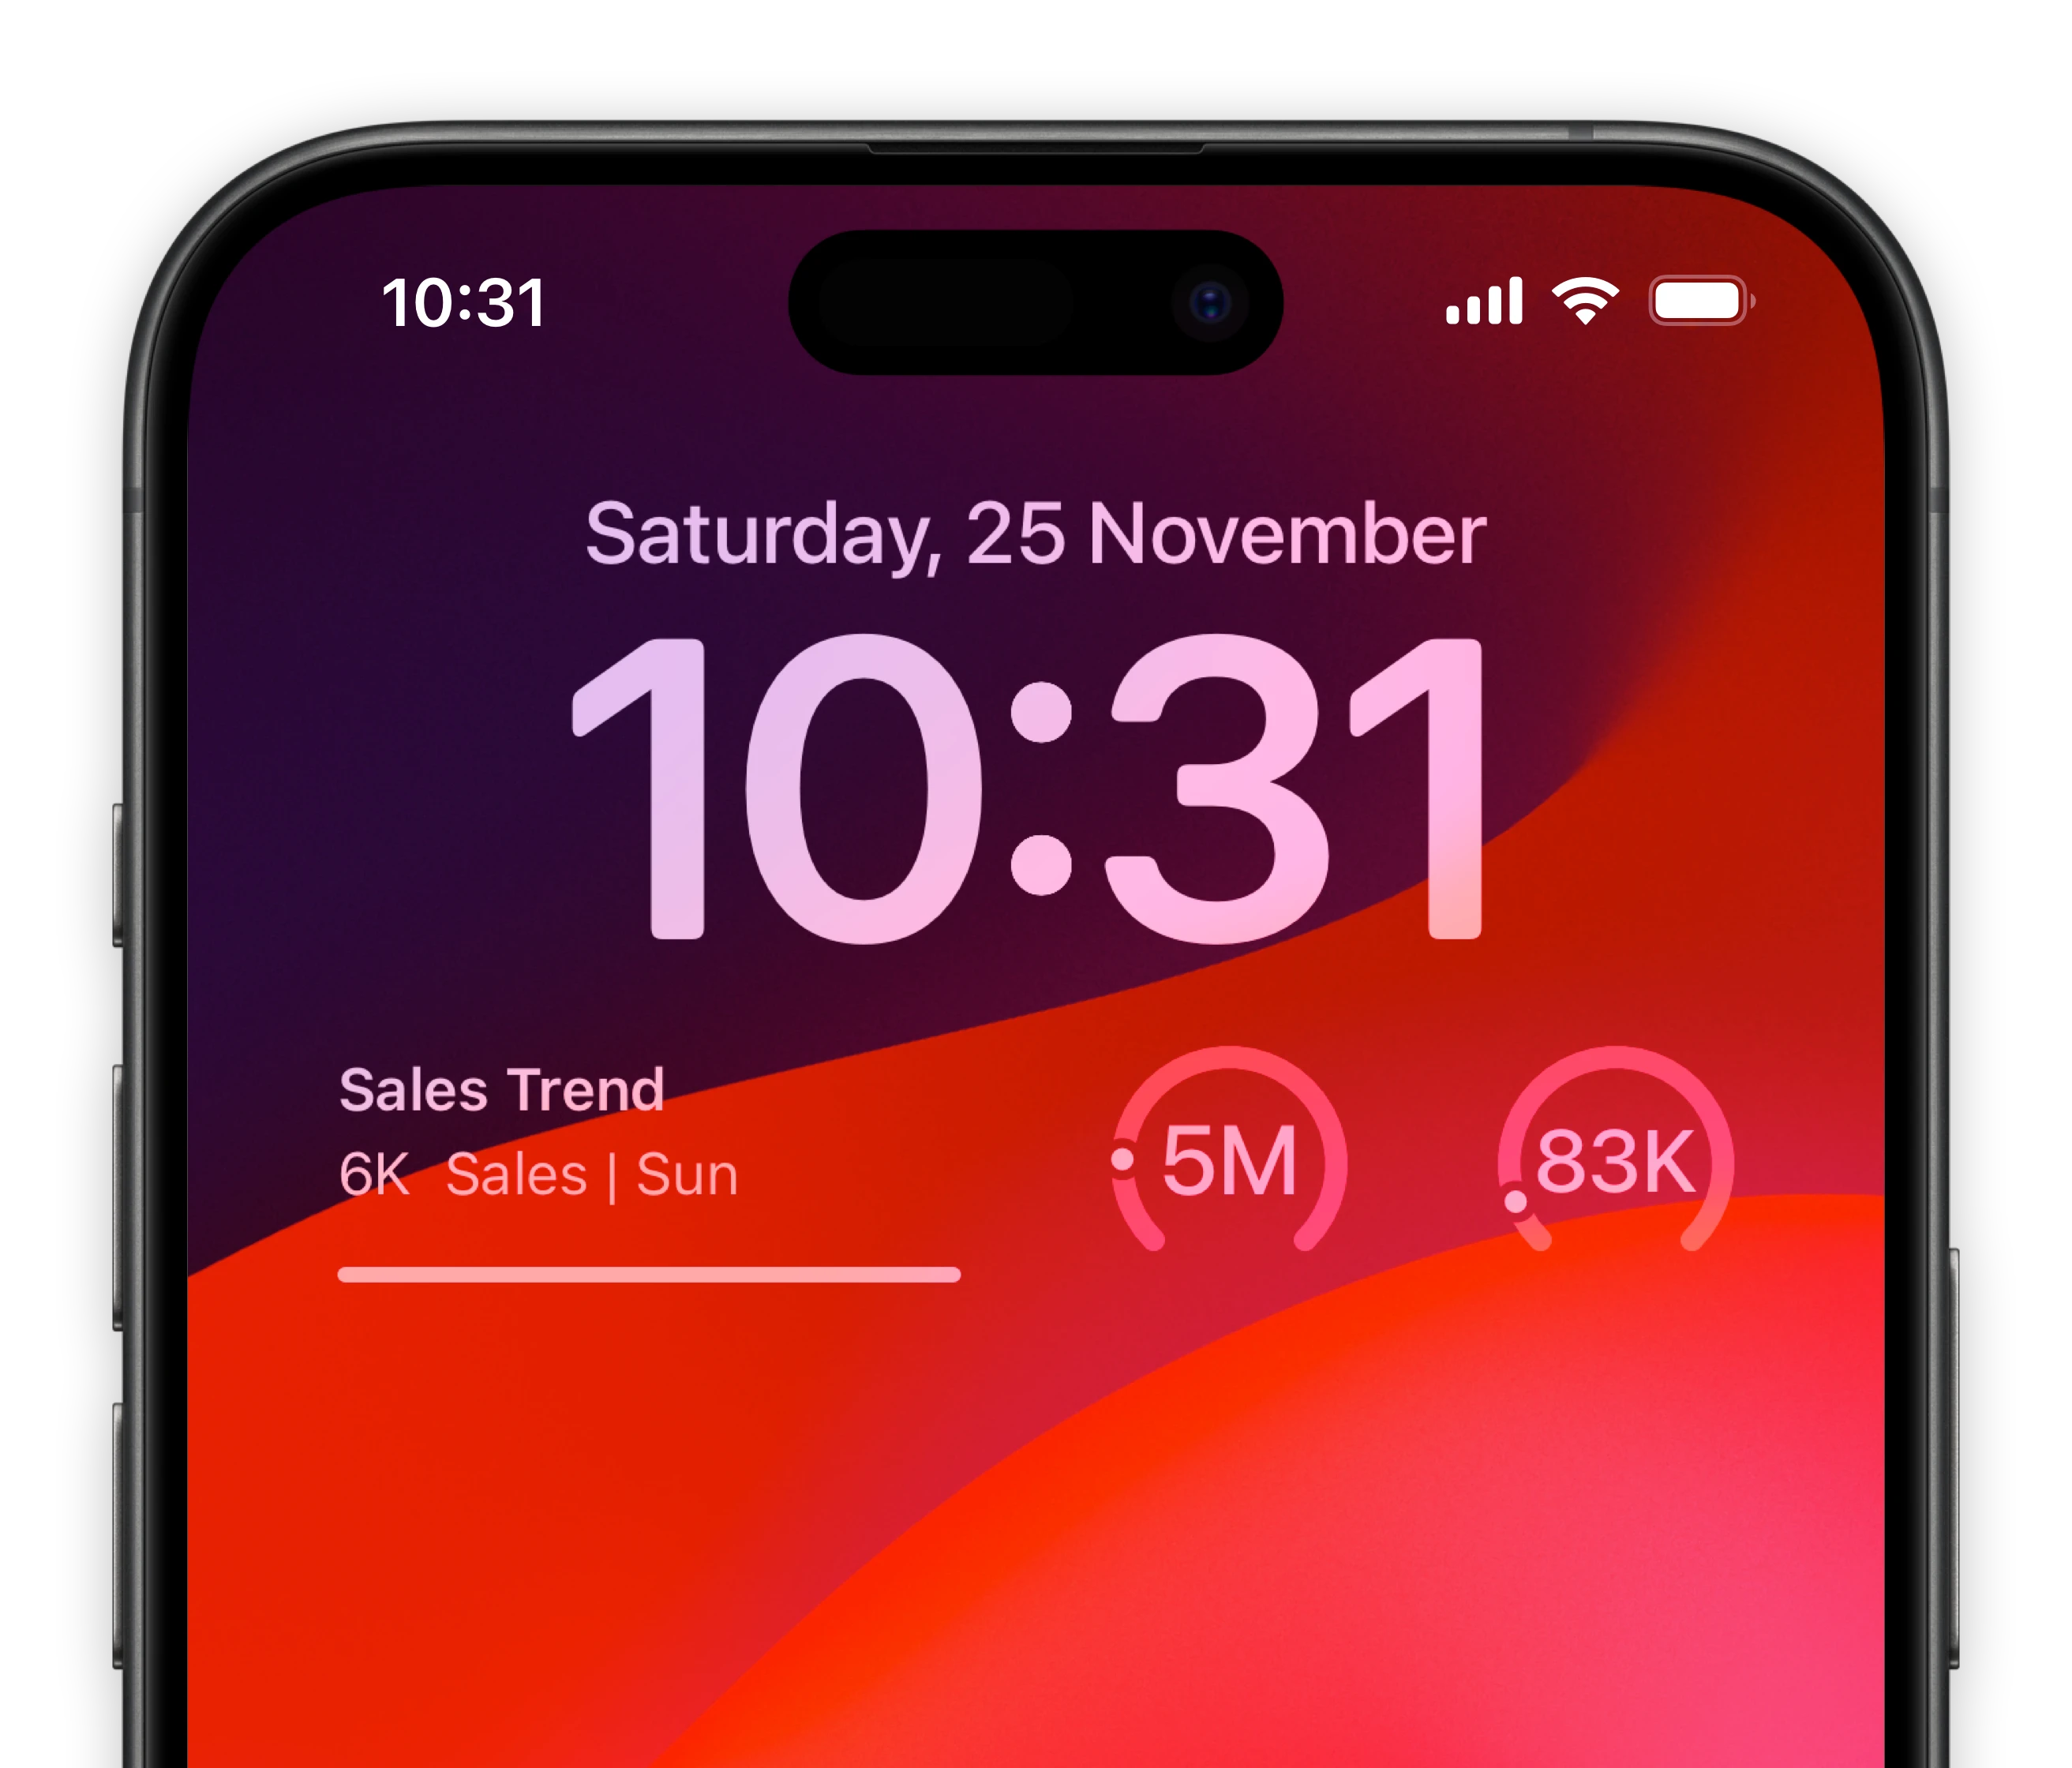
Lock-screen widgets on your iPhone.
Keep track of your most important social media marketing metrics of Facebook right from your iPhone lock screen.
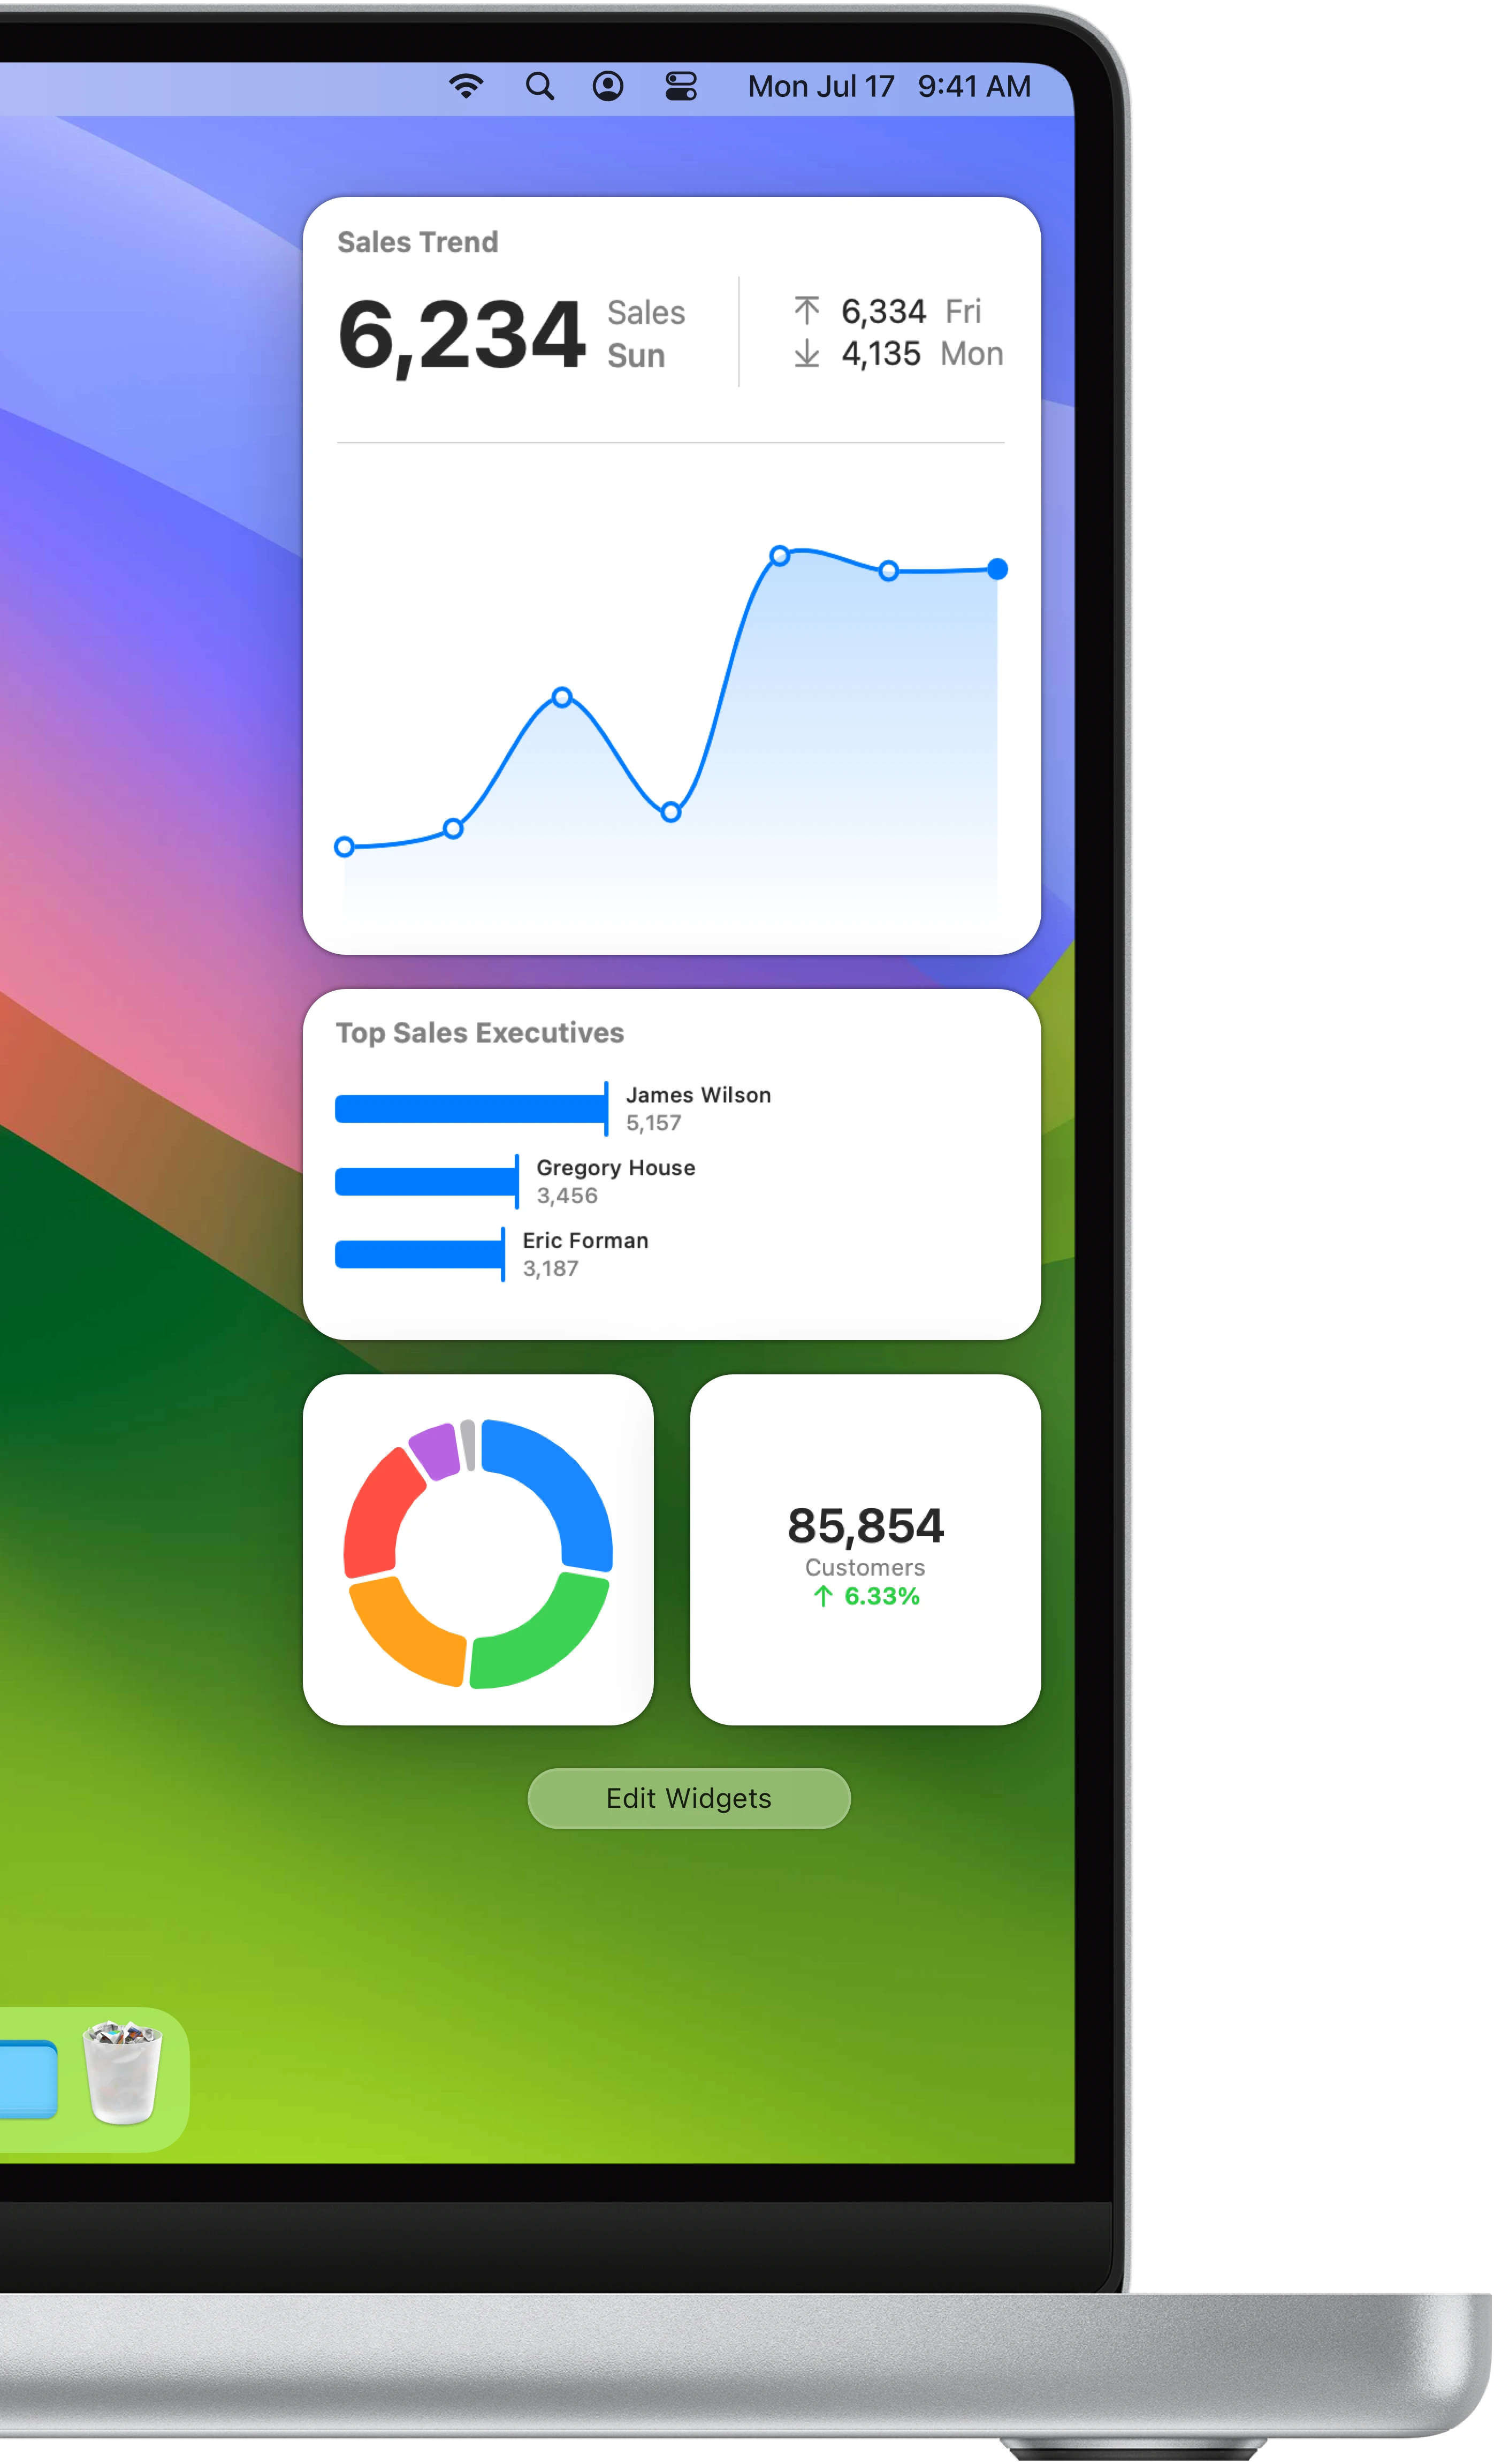
Notification center widgets for your Mac.
Connect your Facebook metrics to your MacOS sidebar.
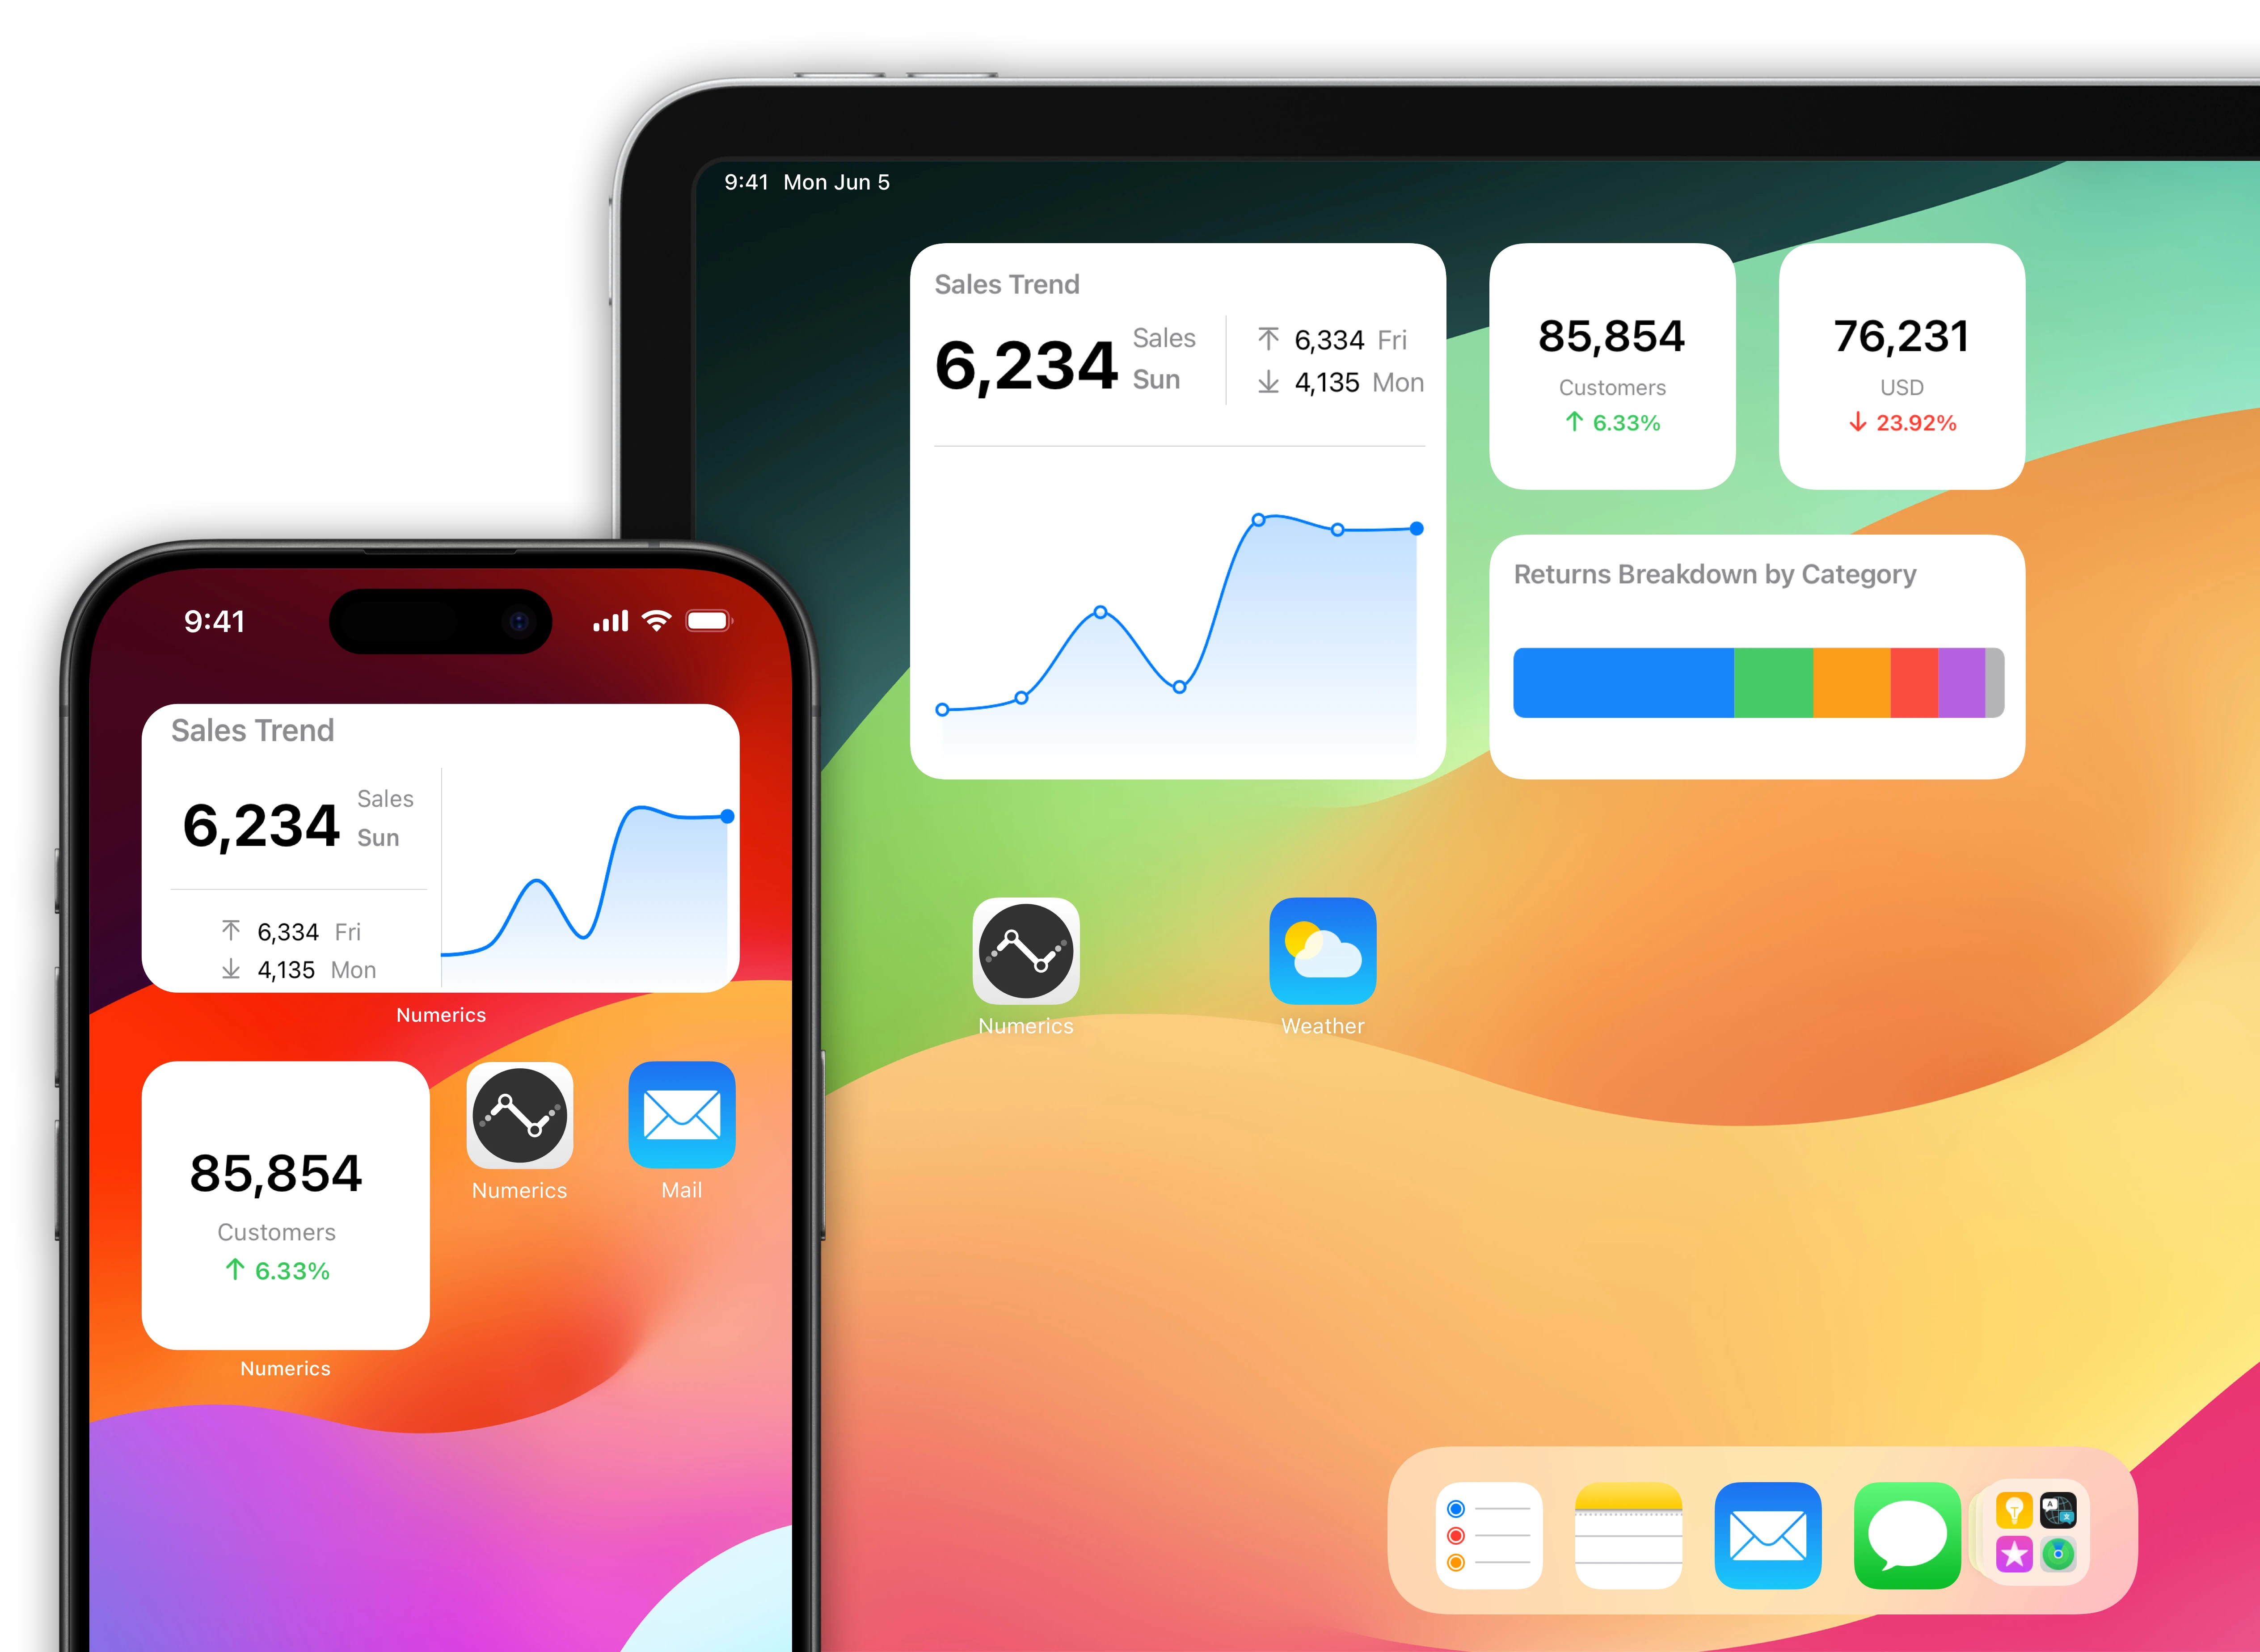
Facebook data driven home screens for your iOS Devices.
Native home screen widgets for your iPad & iPhone powered by data from your Facebook account.
Watch complications for your Apple Watch faces.
Design a custom marketing watch face using Facebook data.

Make Siri Facebook data aware!
"Hey Siri, what's the like rate on my recent post?"
Like rate for recent post is 74% with a value of 888,000 likes out of 1.2M.

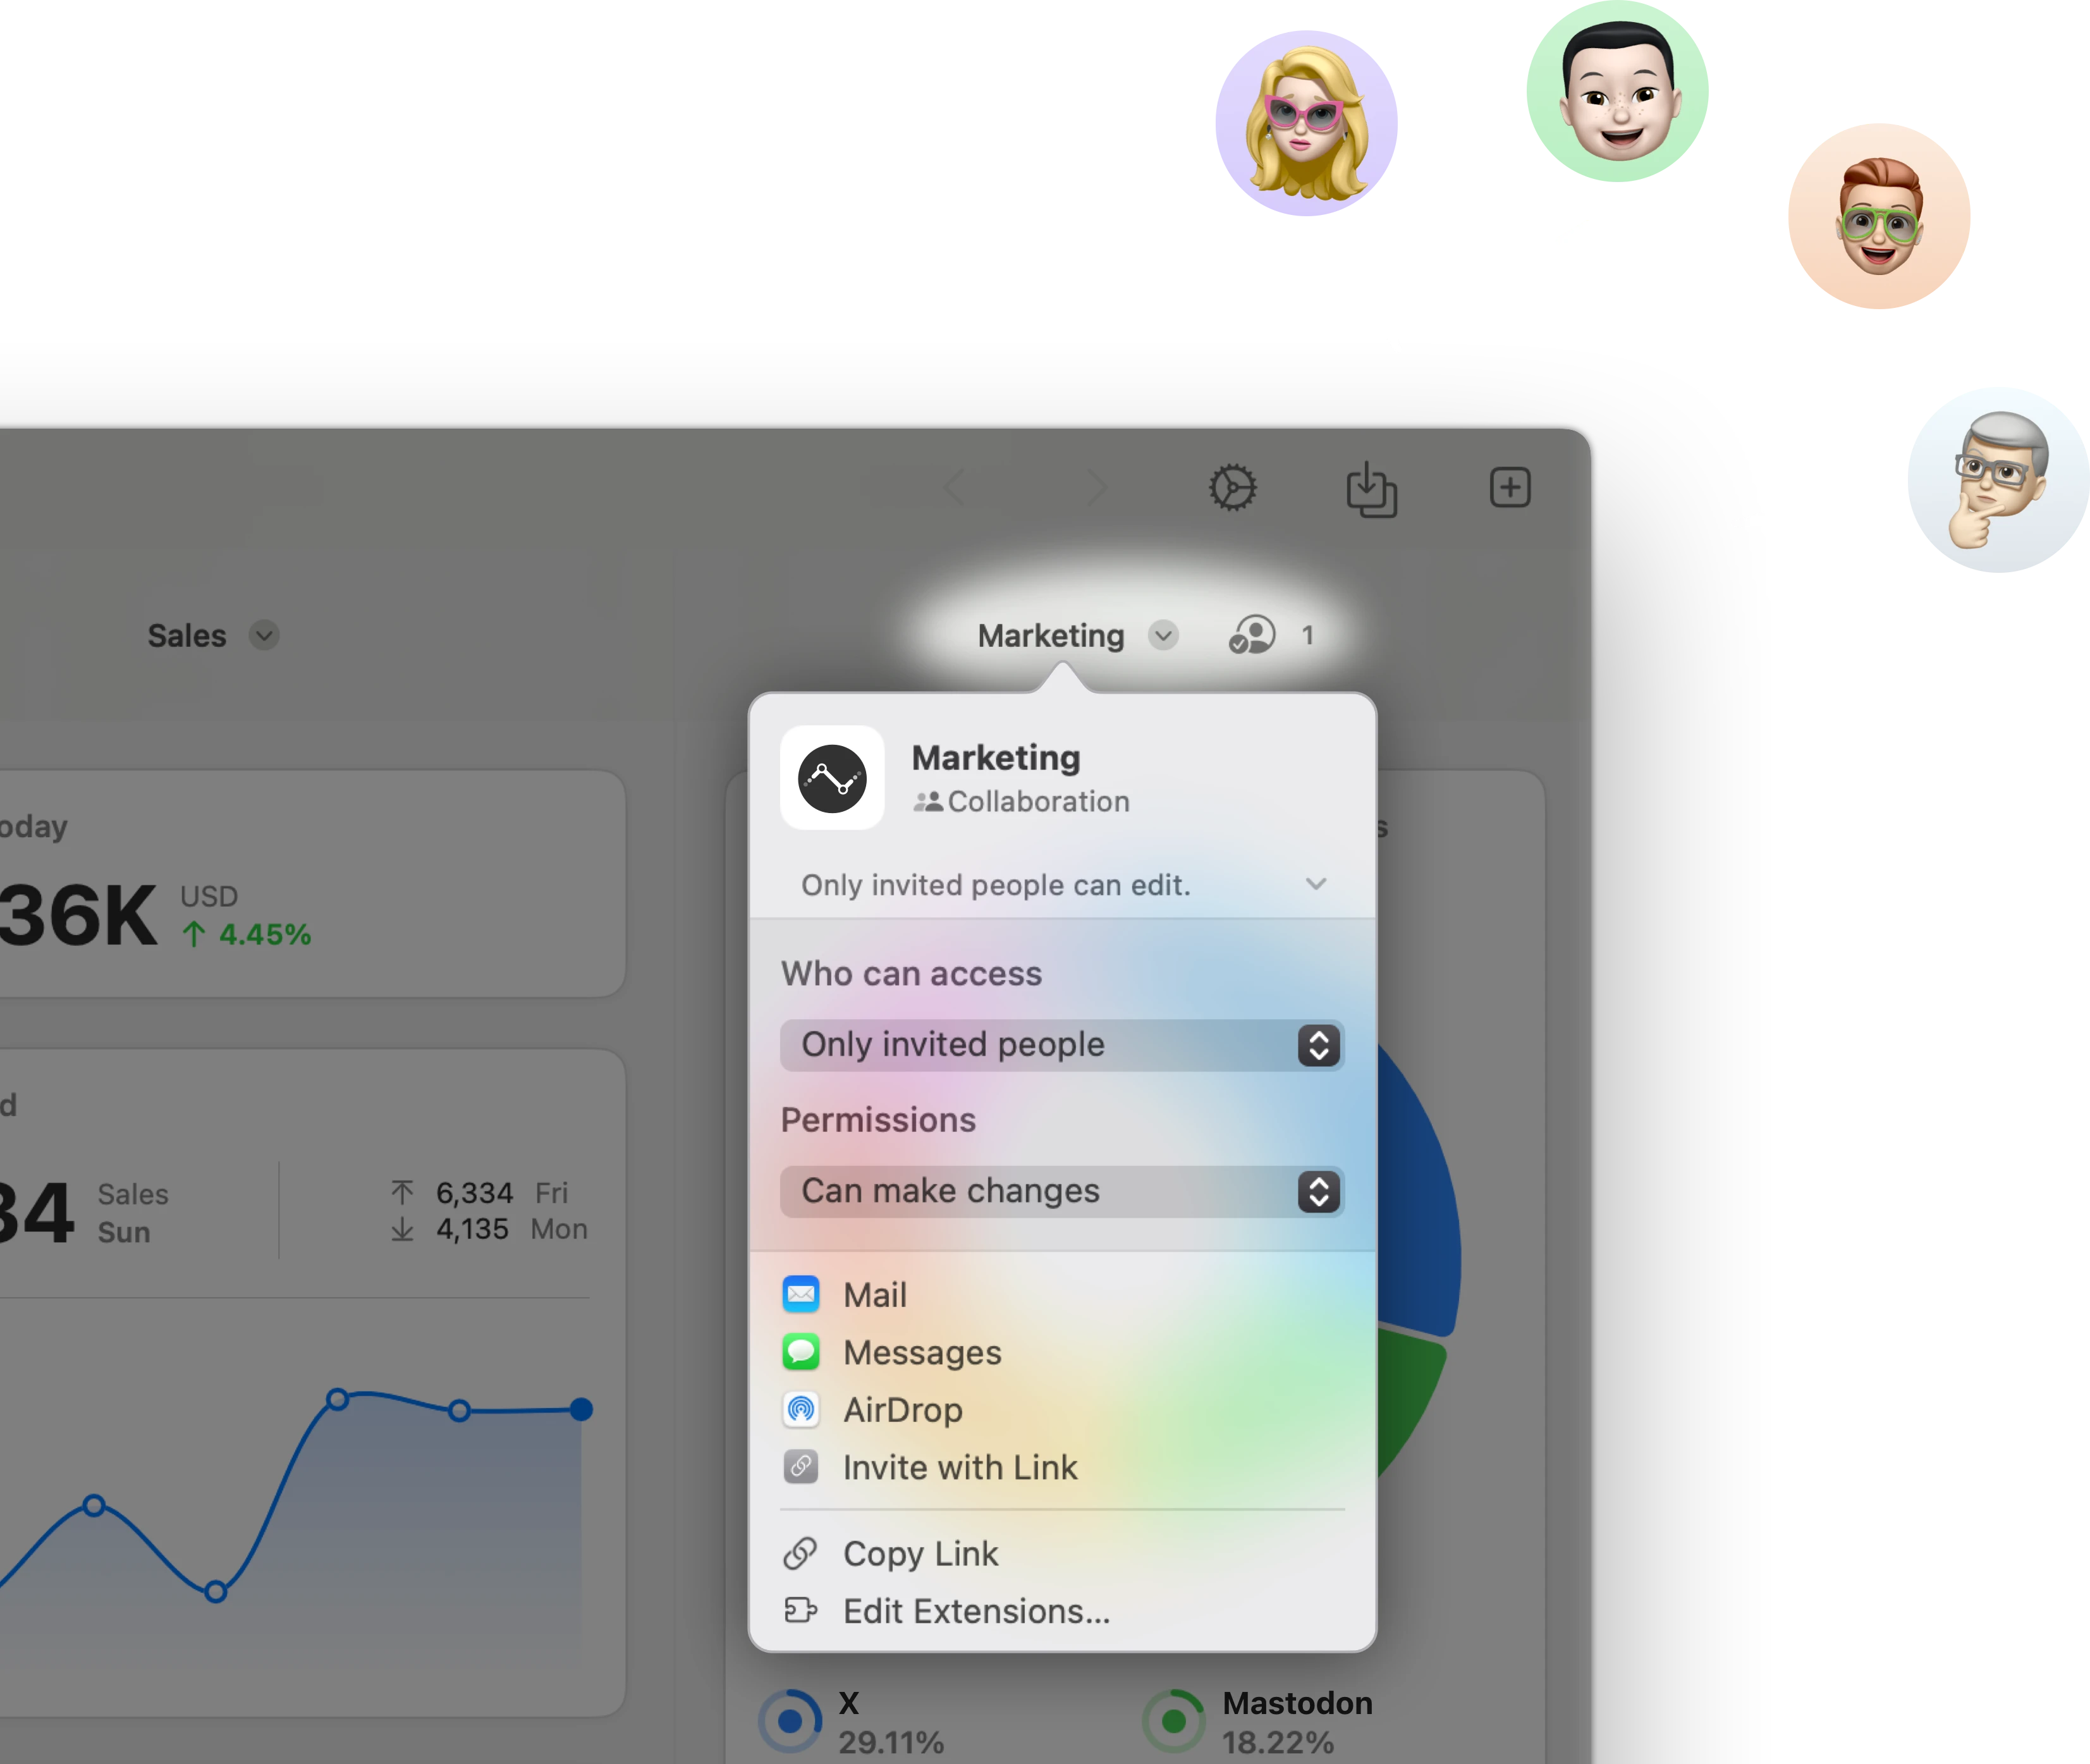
Stream & share Facebook KPIs with other users.
Stream a marketing dashboard to other Numerics users & co-create dashboards with your team in real-time via secure iCloud sharing & collaboration with Messages.
Related Documents:

Related Blog Posts:
Facebook Integration Specifications:
Widget Templates:
95
Authentication Type:
OAuth 2.0
Supported plans:
Facebook Business Account
Meta Platforms, Inc. Support:
Facebook Integration Specifications:
Widget Templates:
95
Authentication Type:
OAuth 2.0
Supported plans:
Facebook Business Account
Meta Platforms, Inc. Support:
Facebook Integration Specifications:
Widget Templates:
95
Authentication Type:
OAuth 2.0
Supported plans:
Facebook Business Account
Meta Platforms, Inc. Support:
Related Integrations


Users ❤️ Numerics
Users ❤️ Numerics
Customer Spotlight
Phil Steadman, VP of Operations - Ajax Mazda explains how they use Numerics across their 5 dealerships in Ontario, Canada.
Reviews from the App Store:
Reviews from the App Store:
Wow!!!
This is an incredible and groundbreaking app! One is usually overwhelmed by statistical information that is hard to find and even worse to interpret. For the first time ever, you can choose what you want to see, in the way that you want to see it - all in a beautifully stunning, clutter-free and simple to use interface. It is super easy to setup and use and, incredibly easy to customize. It clearly shows all you need to see and nothing you don't. I now easily monitor my Facebook pages, several websites, my blog, Twitter and YouTube channels in one app! Well done guys! Well done! Someone seriously deserves a good Whisky! I highly recommend!
Christo van Zyl
South Africa
A vital app for all businesses
I run a startup company and Numerics is vital for me to keep track of all business related statistics such as webpage analytics, Facebook and Twitter followers - even internal performance indicators from Google docs.
Tomas Ahlström
Sweden
A dream come true!
This is an amazing app that cuts off front end development if you want to build a stats dashboard. The large list of services also makes it easier to connect to services that are already in use like Google Analytics and social media accounts.
Dezainr
United States
Excellent!!
I literally demo'd 18 different KPI Dashboard apps / services / sites and could not find anything that was better, easier and more effective than Numerics. It is very easy to setup and understand. Absolutely 100% worth it.
Company X'er
Canada
Easy and quick setup, so many integrations included
Ideal for a one person company: many integrations to allow for a quick overview across sources. Custom alerts on specific devices. Fantastic support, helpful and open to executing feature requests!
App Store User
Switzerland
Wow!!!
This is an incredible and groundbreaking app! One is usually overwhelmed by statistical information that is hard to find and even worse to interpret. For the first time ever, you can choose what you want to see, in the way that you want to see it - all in a beautifully stunning, clutter-free and simple to use interface. It is super easy to setup and use and, incredibly easy to customize. It clearly shows all you need to see and nothing you don't. I now easily monitor my Facebook pages, several websites, my blog, Twitter and YouTube channels in one app! Well done guys! Well done! Someone seriously deserves a good Whisky! I highly recommend!
Christo van Zyl
South Africa
Easy and quick setup, so many integrations included
Ideal for a one person company: many integrations to allow for a quick overview across sources. Custom alerts on specific devices. Fantastic support, helpful and open to executing feature requests!
App Store User
Switzerland
Excellent!!
I literally demo'd 18 different KPI Dashboard apps / services / sites and could not find anything that was better, easier and more effective than Numerics. It is very easy to setup and understand. Absolutely 100% worth it.
Company X'er
Canada
A dream come true!
This is an amazing app that cuts off front end development if you want to build a stats dashboard. The large list of services also makes it easier to connect to services that are already in use like Google Analytics and social media accounts.
Dezainr
United States
A vital app for all businesses
I run a startup company and Numerics is vital for me to keep track of all business related statistics such as webpage analytics, Facebook and Twitter followers - even internal performance indicators from Google docs.
Tomas Ahlström
Sweden
Wow!!!
This is an incredible and groundbreaking app! One is usually overwhelmed by statistical information that is hard to find and even worse to interpret. For the first time ever, you can choose what you want to see, in the way that you want to see it - all in a beautifully stunning, clutter-free and simple to use interface. It is super easy to setup and use and, incredibly easy to customize. It clearly shows all you need to see and nothing you don't. I now easily monitor my Facebook pages, several websites, my blog, Twitter and YouTube channels in one app! Well done guys! Well done! Someone seriously deserves a good Whisky! I highly recommend!
Christo van Zyl
South Africa
A dream come true!
This is an amazing app that cuts off front end development if you want to build a stats dashboard. The large list of services also makes it easier to connect to services that are already in use like Google Analytics and social media accounts.
Dezainr
United States
Easy and quick setup, so many integrations included
Ideal for a one person company: many integrations to allow for a quick overview across sources. Custom alerts on specific devices. Fantastic support, helpful and open to executing feature requests!
App Store User
Switzerland
A vital app for all businesses
I run a startup company and Numerics is vital for me to keep track of all business related statistics such as webpage analytics, Facebook and Twitter followers - even internal performance indicators from Google docs.
Tomas Ahlström
Sweden
Excellent!!
I literally demo'd 18 different KPI Dashboard apps / services / sites and could not find anything that was better, easier and more effective than Numerics. It is very easy to setup and understand. Absolutely 100% worth it.
Company X'er
Canada
Get Numerics
Get started with your custom KPI dashboards for FREE!


Get Numerics
Get started with your custom KPI dashboards for FREE!
Get Numerics
Get started with your custom KPI dashboards for FREE!