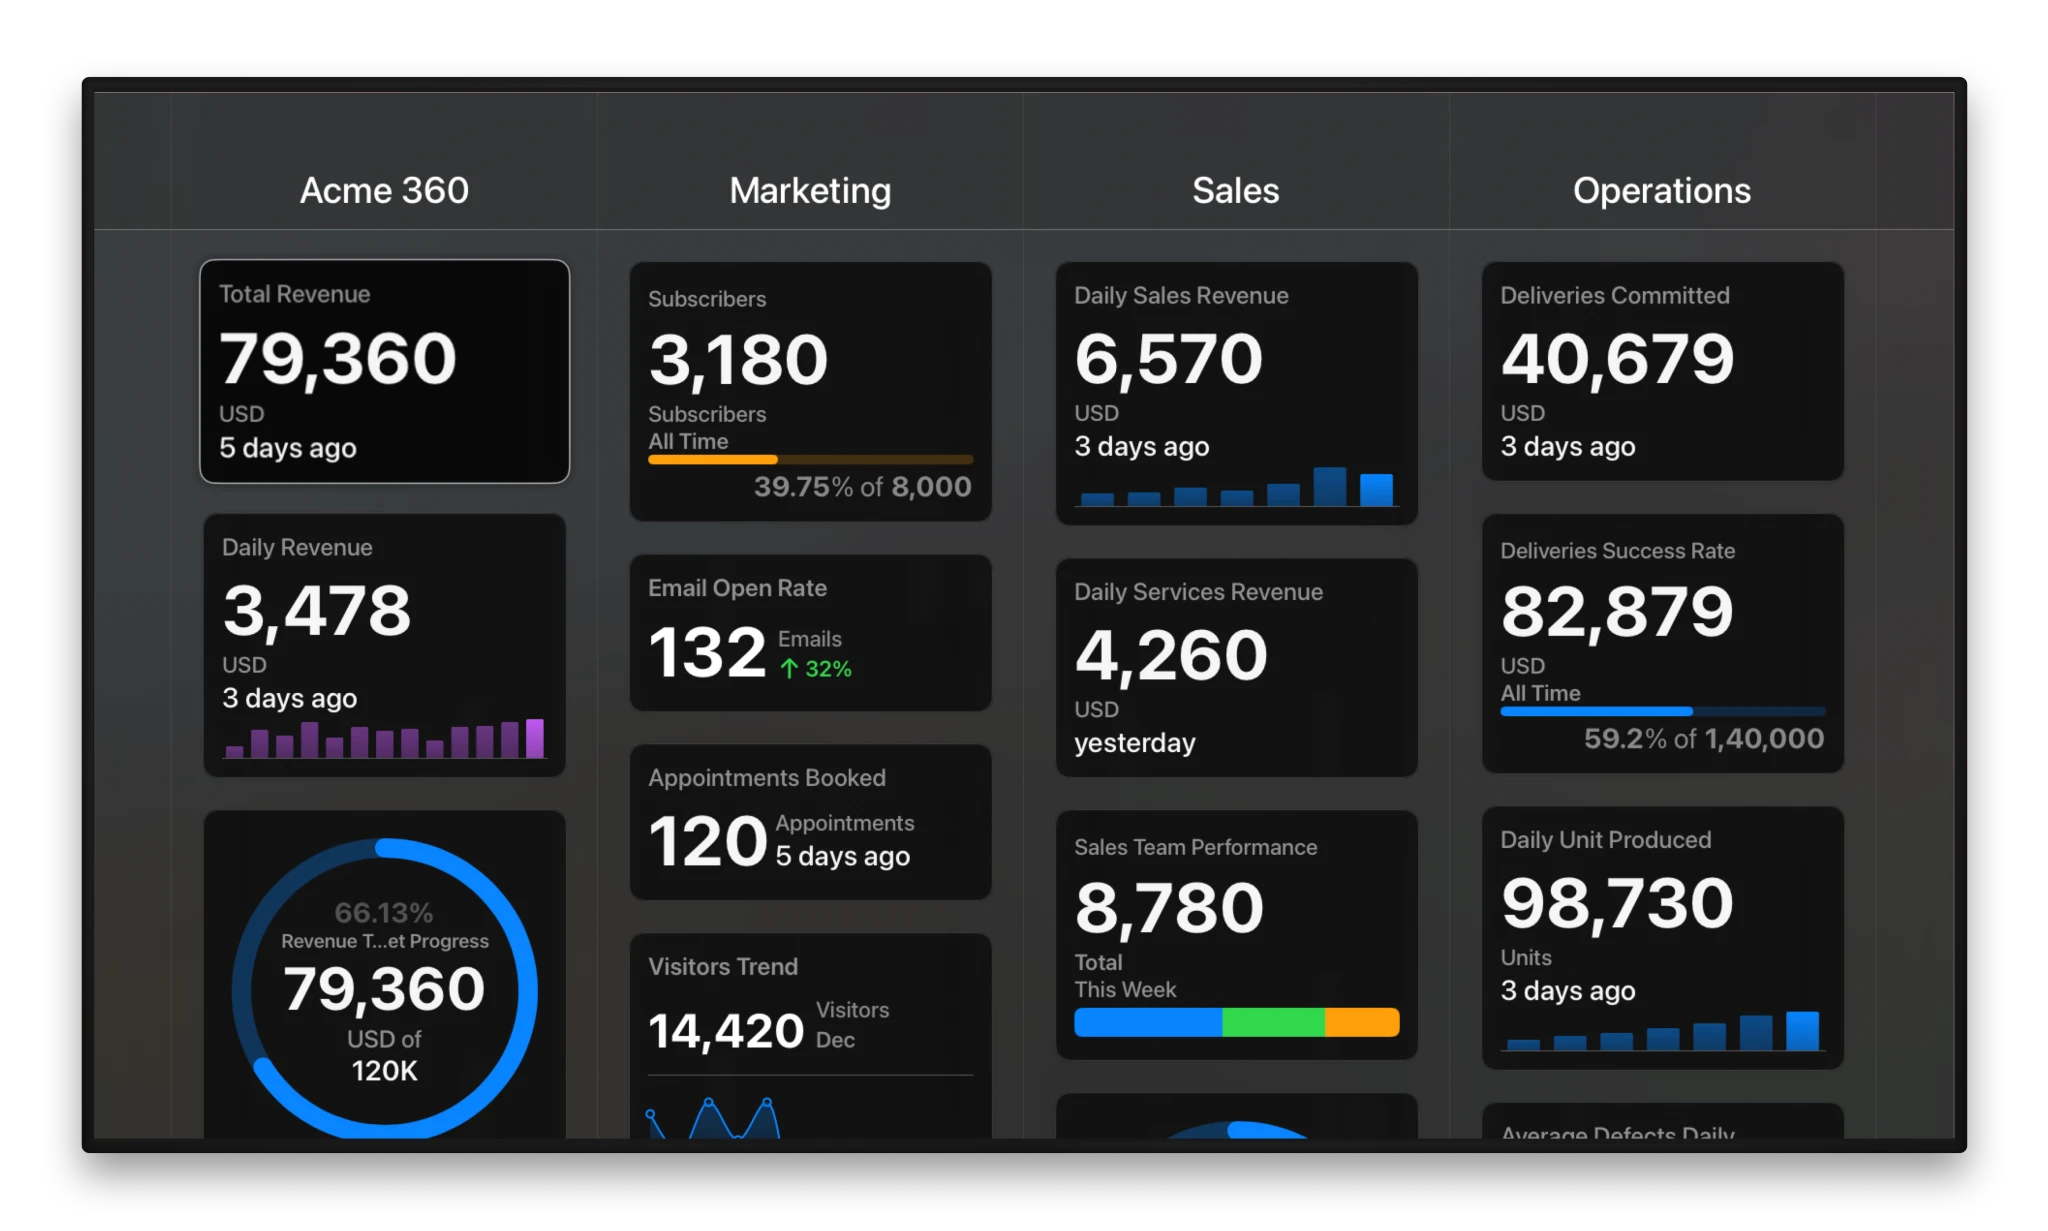
Your Data Story,
Beautifully Told.
Numerics Enterprise transforms complex data into intuitive dashboards that drive decisions. One unified view across all devices keeps your entire team aligned on what matters.
3 Steps to Data Transformation
Import & Organize
Spreadsheet Simplicity Without the Limitations
Organize with 10 different column types.
Text
Numbers
Dates
Status
Tags
Toggles
Ratings
and more…
Built-in calculations (sum, average, distribution) without writing formulas
Visualize & Analyze
From Numbers to Insights in Seconds
Choose from 12+ chart types and widget styles for any business metric

Select any data columns to create instant visualizations
Apply filters to focus on specific data segments
Changes reflect instantly across all visualizations

No design skills needed professional-quality dashboards automatically
Share & Access
One Source of Truth, Everywhere
Share specific dashboards or entire workspaces with stakeholders
Control access with granular, role-based permissions
Everyone sees the same real-time data—no more email attachments

View dashboards through any web browser.
Native apps for iPhone, iPad, Mac, and Apple Watch.

Dedicated Apple TV app for team displays and conference rooms
Real Results
Queensway Automotive Group
5% increase in gross per car through dashboards that created healthy competition between dealership with real-time updates maintaining motivation.

Alo Yoga
100,000+ Real-time tracking of 100,000+ daily shipments identified bottlenecks immediately, optimizing logistics and improving delivery performance.
Organizations using Numerics don't just see data differently
they transform their business.
Schedule a 30-minute demo to see your actual business data transformed into actionable dashboards. Discover insights hidden in your numbers today.


