
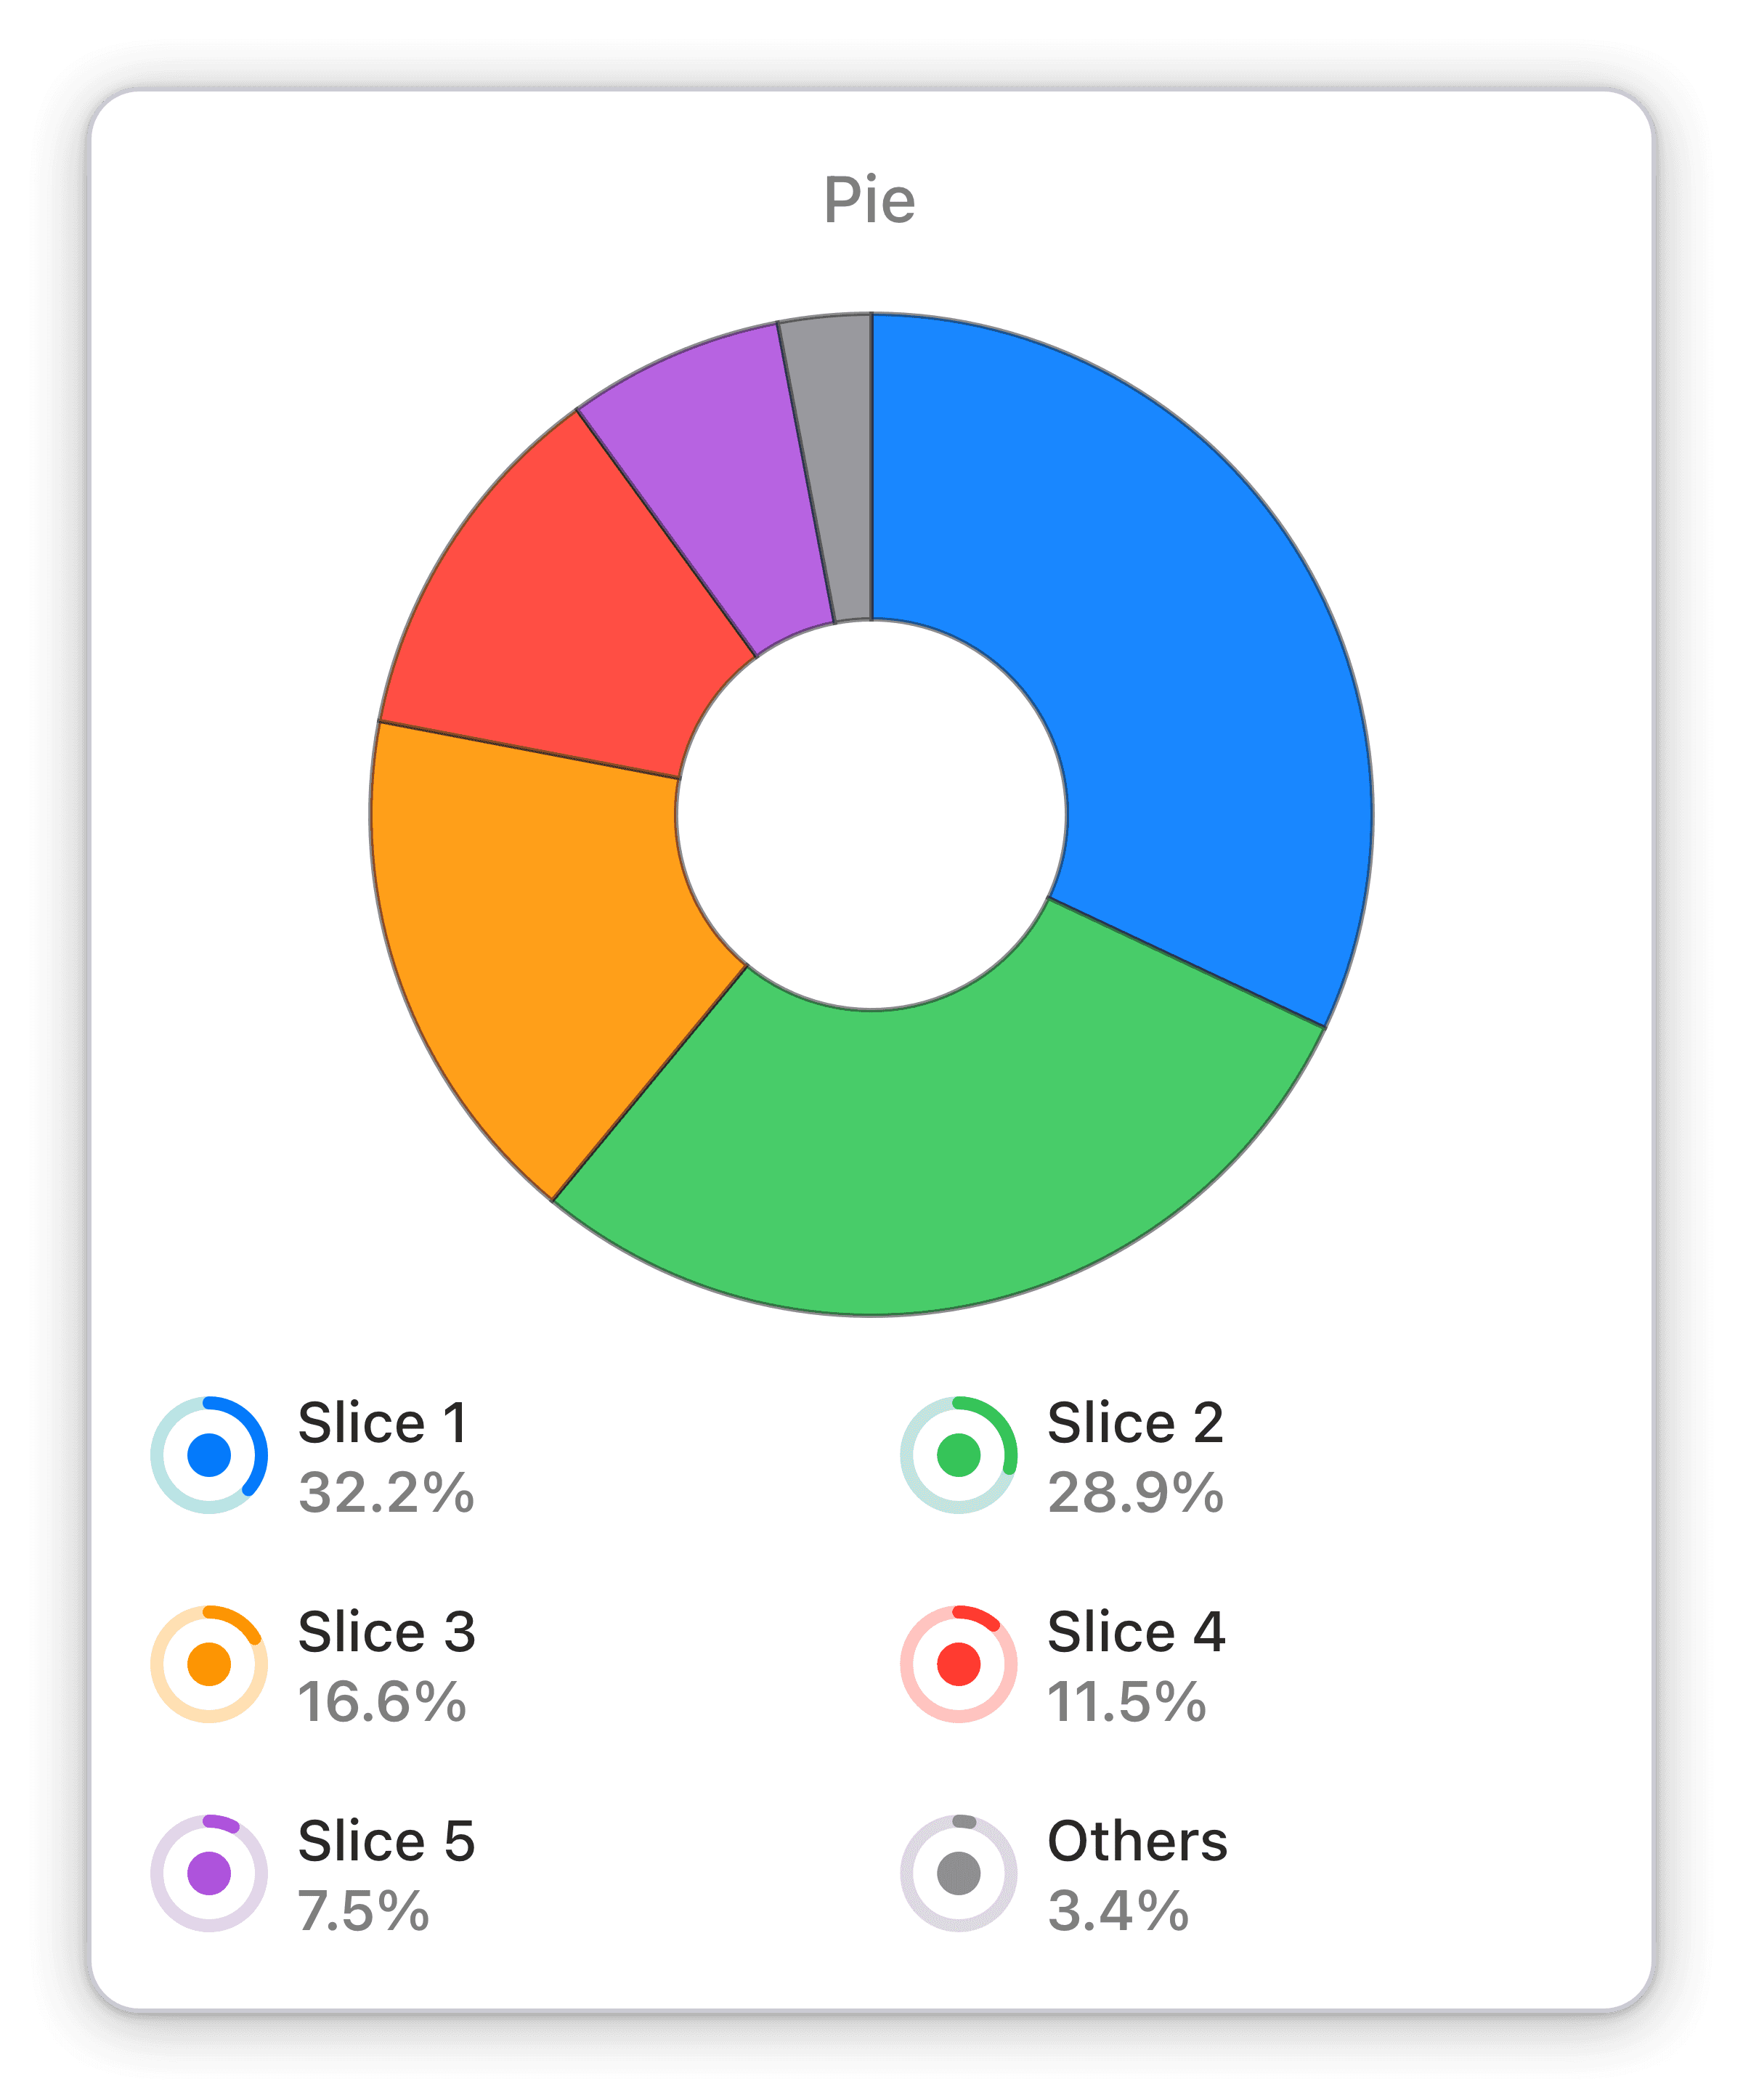
Pie chart from JSON data
Create a pie chart widget from your custom JSON data based on the Numerics Widget Data Specification.
Get real-time insights of your KPIs with Numerics' Custom JSON Pie Chart widget. Easily visualize your data and make informed decisions.
If you're looking for a way to visualize your custom JSON data, look no further than Numerics' custom JSON pie chart widget. With this widget, you can easily create a pie chart that shows the breakdown of a specific KPI, giving you a clear and concise overview of how that metric is performing in real-time. Whether you're looking to track sales, website traffic, or any other important metric, the custom JSON pie chart widget is the perfect tool for the job.
With Numerics' custom JSON pie chart widget, you can keep a pulse on your KPIs in real-time. Imagine having a clear overview of how your business is performing at all times, without having to manually track data. With this widget, you can easily visualize and understand the data that matters most to you - all in one place. By being aware of the real-time value of your KPIs, you can make informed decisions that can help drive your business forward.
Part of the Json
Advanced Widget Pack

