

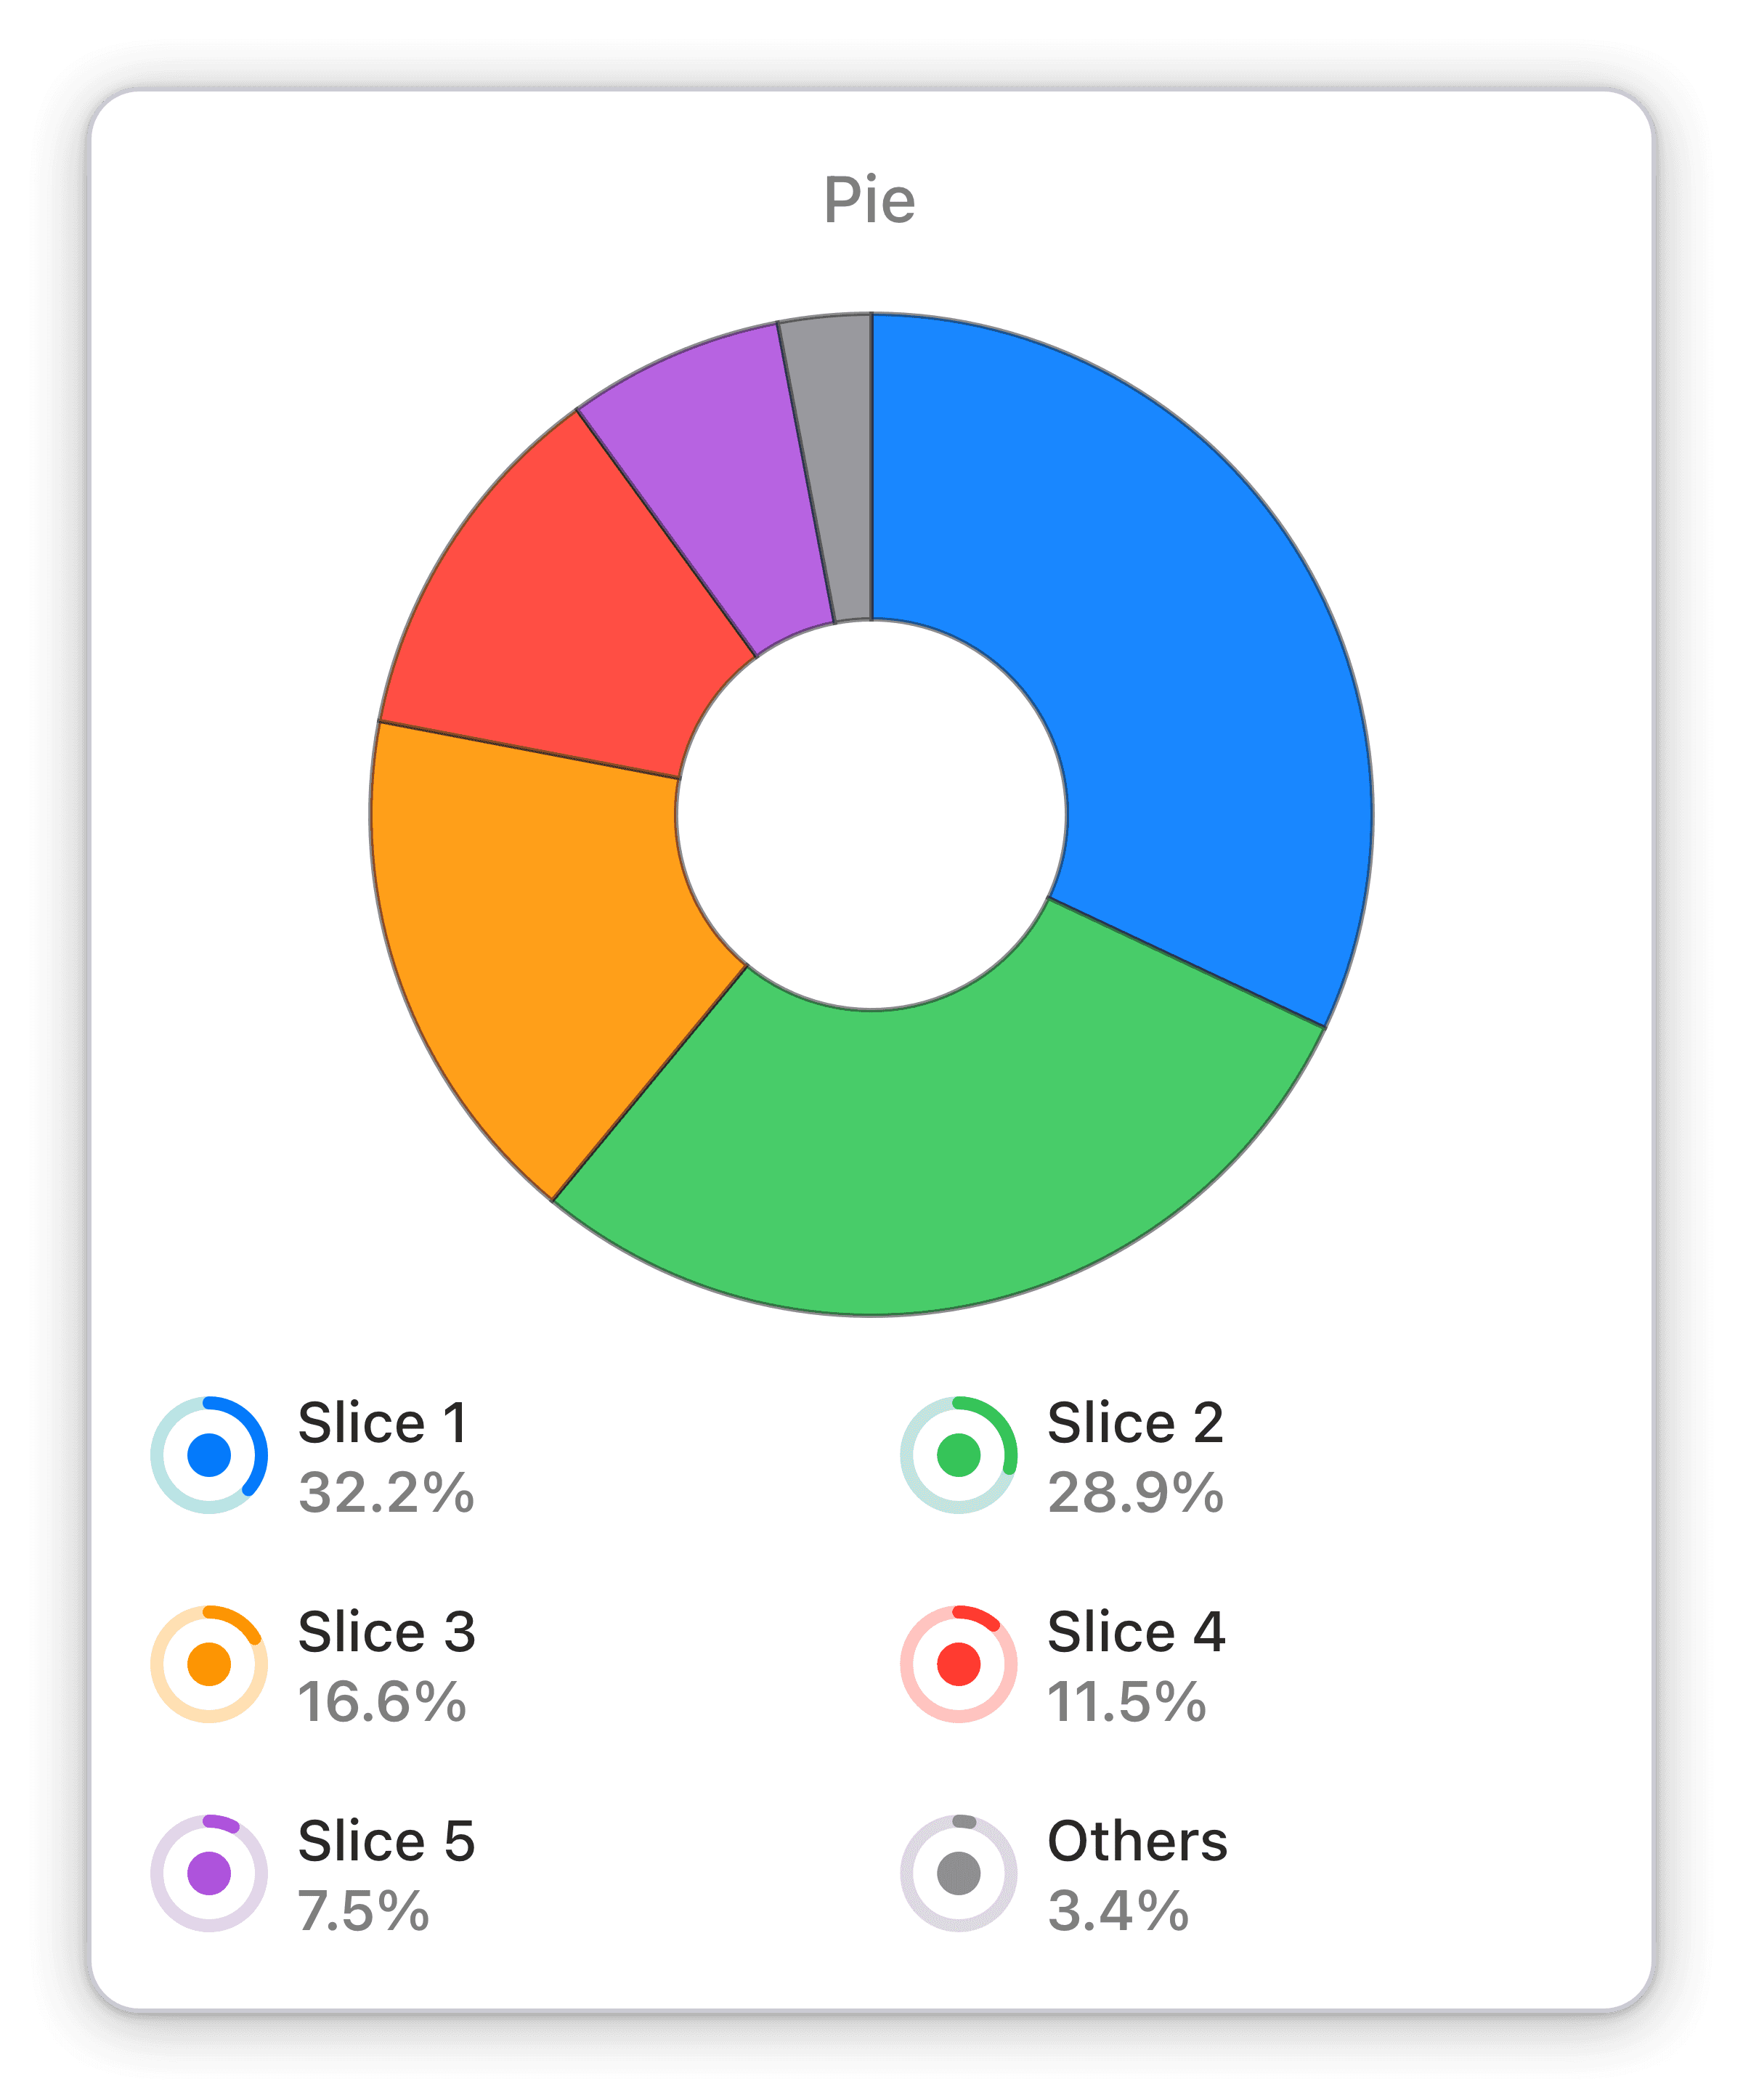
Distribution of post reactions
The post reactions broken down by reaction types.
Track Facebook post engagement with Distribution of Post Reactions widget on Numerics. Optimize content strategy with data-driven insights.
The Distribution of Post Reactions widget for Facebook on Numerics lets you visualize the engagement levels of your Facebook posts in real-time through an interactive Pie chart. With this widget, you can quickly view which reactions are generating the most responses, helping you make data-driven decisions to optimize your content strategy. Stay up-to-date with your Facebook metrics and take proactive steps to boost your social media presence with Numerics.
Benefits of Tracking Distribution of post reactions in Facebook marketing dashboards
The Distribution of Post Reactions widget for Facebook on Numerics lets you track the engagement levels of your Facebook posts in real-time, giving you an immediate pulse on how your content is performing with your audience. With this widget, you can quickly identify which reactions are eliciting the most responses, helping you make data-driven decisions to optimize your content strategy. Stay up-to-date with your Facebook metrics and take proactive steps to boost your social media presence with Numerics.
Full Integration Details:
Part of the facebook
Post Reactions Widget Pack
More Facebook Widget Packs:


Facebook Integration Specifications:
Widget Templates:
95
Authentication Type:
OAuth 2.0
Supported plans:
Facebook Business Account
Meta Platforms, Inc. Support:

