

Repository languages distribution
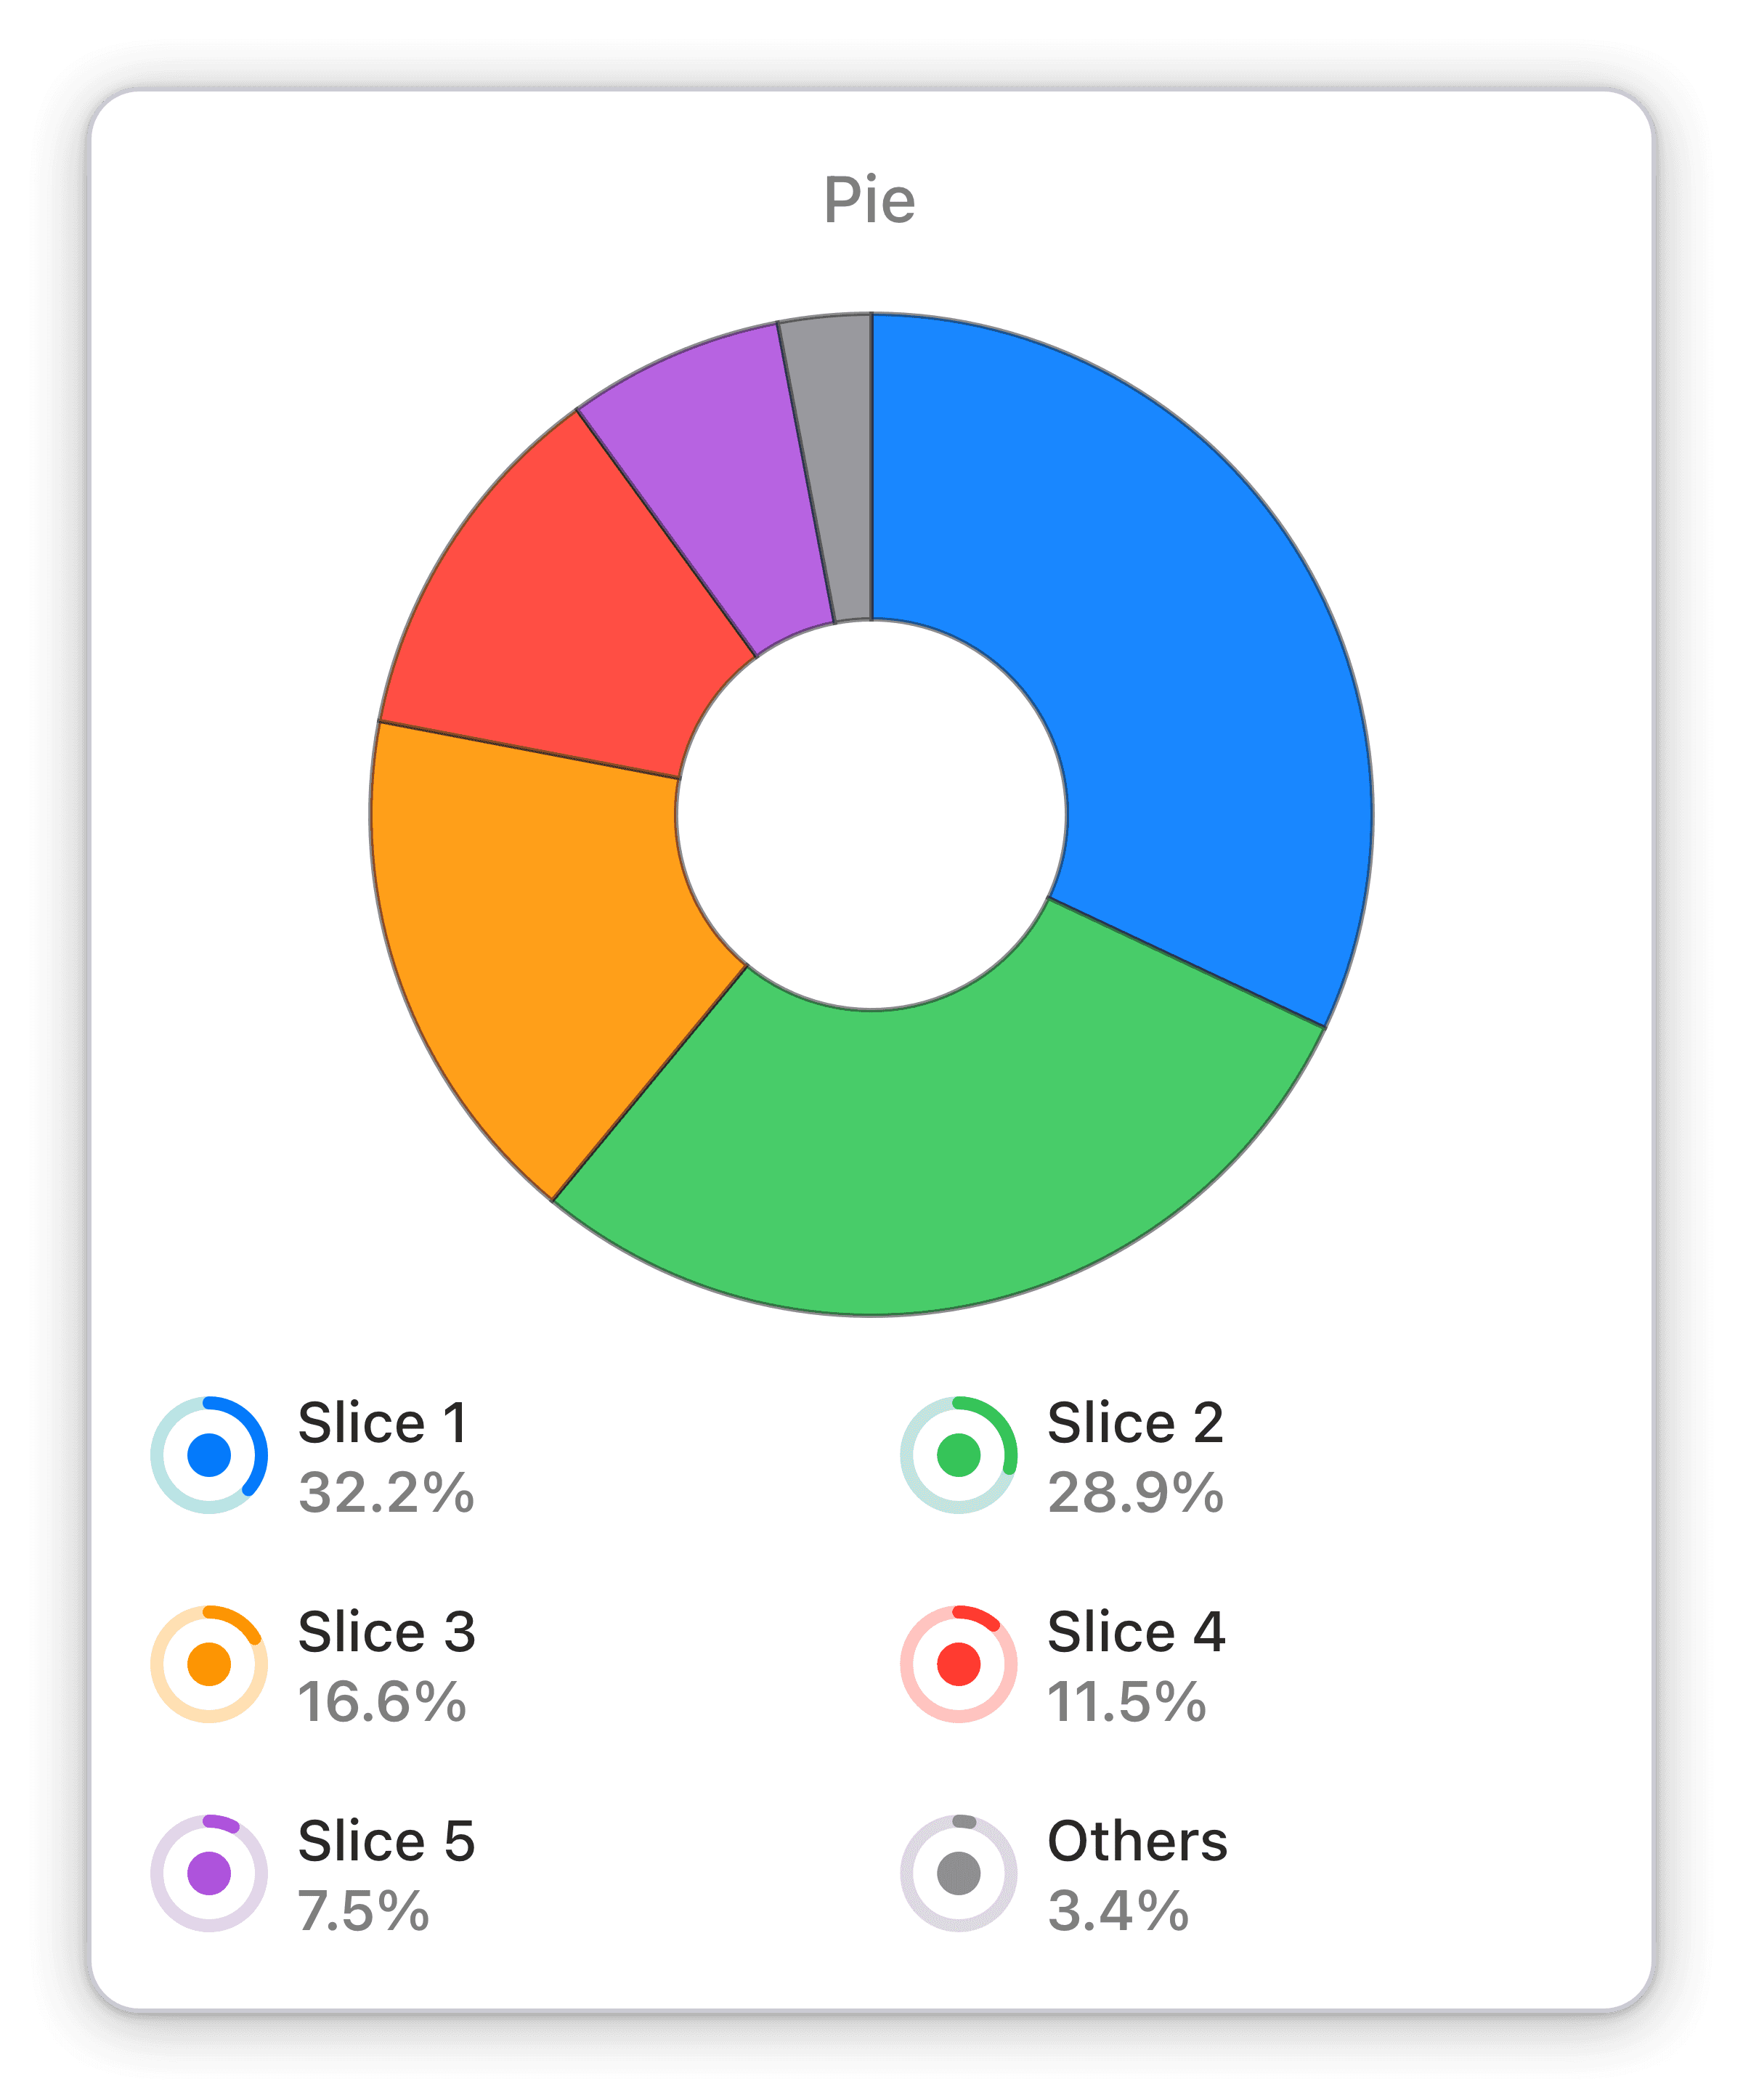
The distribution of languages used in one of your organization’s repositories by the total bytes of code.
Track and monitor programming language distribution in your GitHub repository with Numerics' Pie Chart widget.
Introducing the Pie Chart widget - a simple and visual way to track the distribution of programming languages used in one of your organization's repositories. With this widget, you can easily identify trends and areas for improvement in your development processes. Stay ahead of the competition by making data-driven decisions in real-time, resulting in increased efficiency, productivity, and profitability.
Benefits of Tracking Repository languages distribution in GitHub team performance dashboards
The ability to track and monitor key performance indicators (KPIs) in real-time can be the difference between success and failure in today's fast-paced business environment. With Numerics, users can easily design live dashboards that display their most important metrics at a glance. The pie chart widget, in particular, provides a clear and concise visualization of the distribution of languages used in one of your organization's repositories, making it easy to identify trends and areas for improvement. By keeping an eye on this KPI, businesses can optimize their development processes and ensure that they are using the most efficient and effective programming languages for their projects. With Numerics, users can stay ahead of the competition by making data-driven decisions in real-time, resulting in increased efficiency, productivity, and profitability.
Full Integration Details:
Part of the github
Organization Widget Pack
More GitHub Widget Packs:


GitHub Integration Specifications:
Widget Templates:
27
Authentication Type:
OAuth 2.0
Supported plans:
All
API Rate limit:
1,5000 requests per hour

