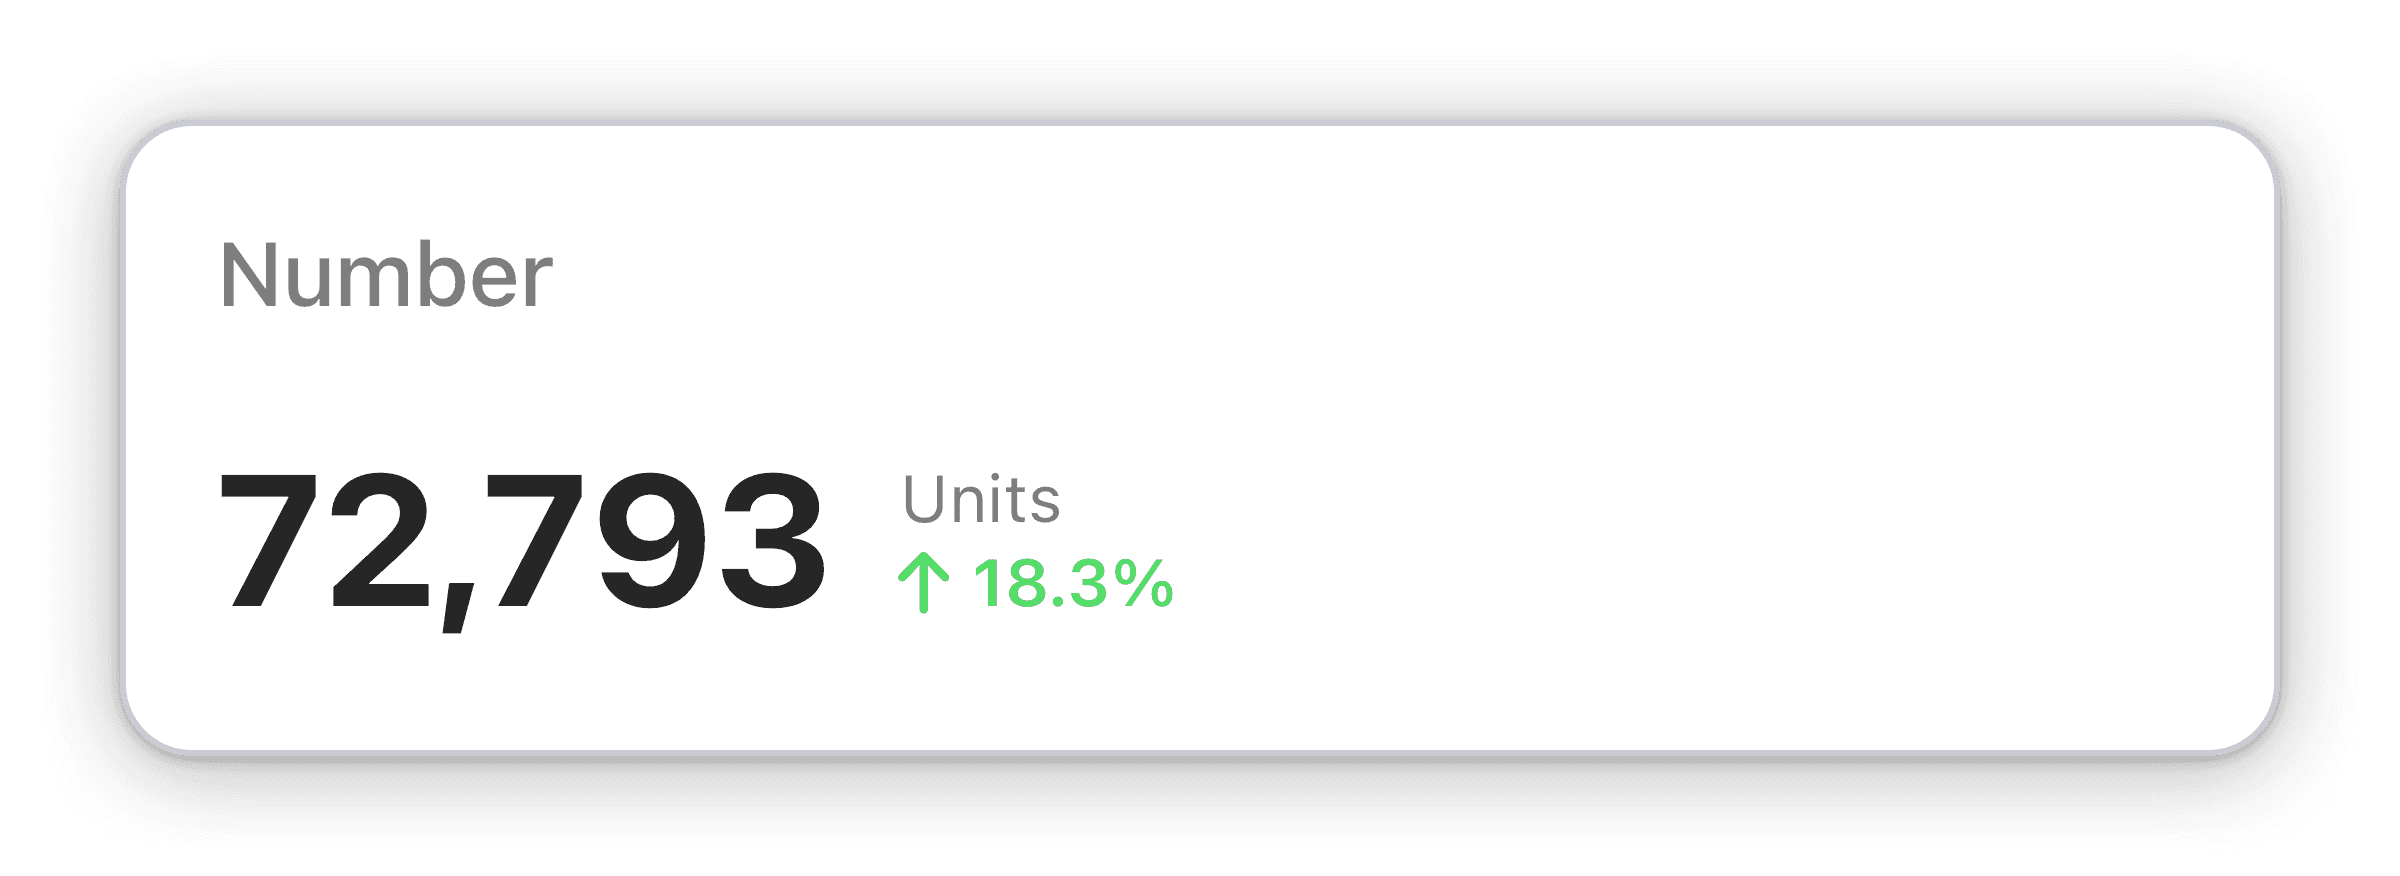
Number and difference indicator from spreadsheet data
Visualize your custom numbers and percentage change values from a Google Spreadsheet.
Track custom KPIs with real-time updates in Numerics' Number and Difference Indicator widget powered by Google Spreadsheets.
Track your custom KPIs with Google Spreadsheets' Number and Difference Indicator widget in Numerics. Keep an eye on your business goals with a clear and concise visualization of your data, including numeric tallies and percentage change indicators. Gain a competitive edge by staying informed about your business metrics at all times and making informed decisions with real-time data at your fingertips.
Benefits of Tracking Number and difference indicator from spreadsheet data in Google Spreadsheets Custom Data dashboards
Track your custom KPIs with real-time updates in Numerics' Number and Difference Indicator widget powered by Google Spreadsheets. Stay on top of your business goals with a dashboard that visualizes your data and provides you with insights at a glance. With Numerics, you can design live dashboards that run natively on your device and make secure, direct connections to your data sources, giving you the scalable and secure performance you need. Gain a competitive edge by staying informed about your business metrics at all times and making informed decisions with real-time data at your fingertips.
Full Integration Details:
Part of the google spreadsheets
Advanced Widget Pack
Get more insights into your business with custom line graphs, pie charts, density charts and more from spreadsheet data.
More Google Spreadsheets Widget Packs:
Google Spreadsheets Integration Specifications:
Widget Templates:
11
Authentication Type:
OAuth 2.0
Supported plans:
All


