Average session duration - historic
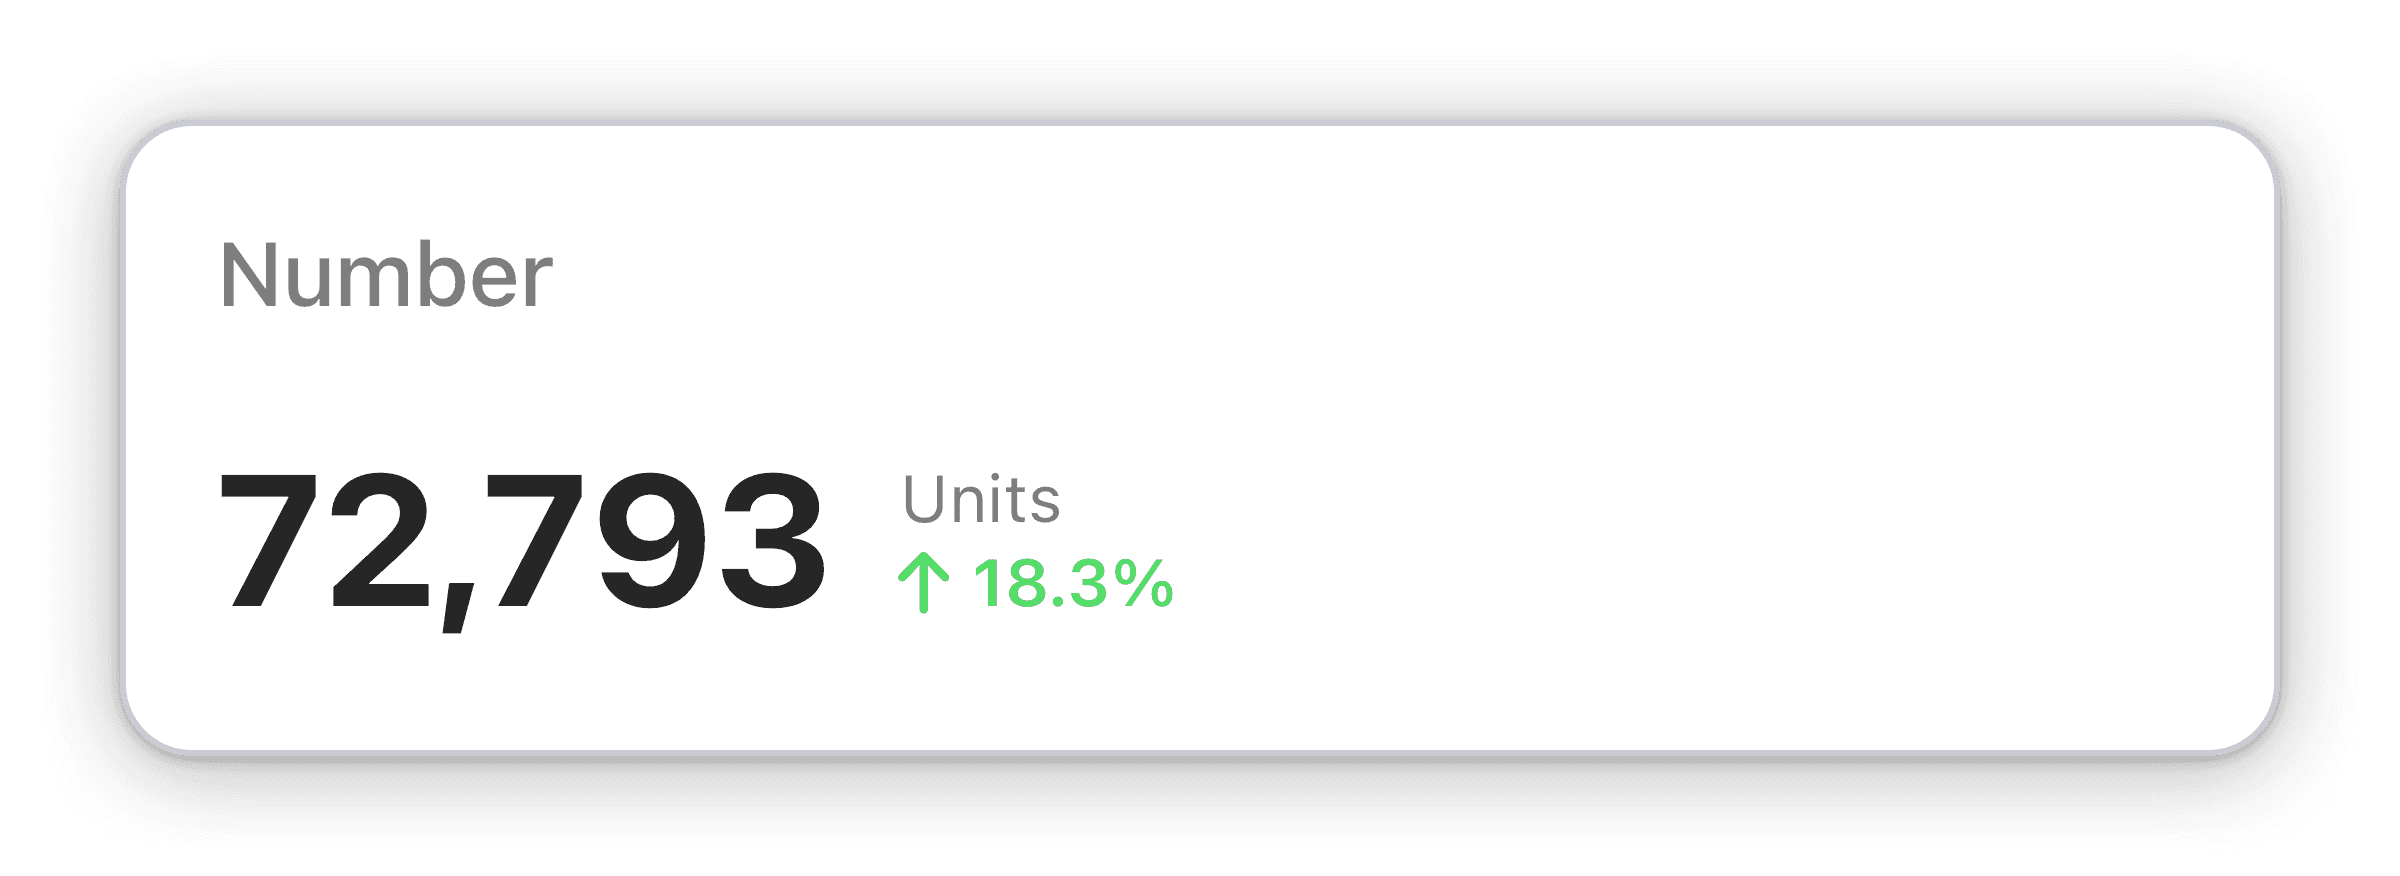
The total number of average session duration on your app, along with the difference in percentage from its previous period within your chosen time span.
Track app performance with Numerics' Google Universal Analytics Average Session Duration - Historic widget, identifying trends & improving user experience.
The Google Universal Analytics Average Session Duration - Historic widget in Numerics helps you track the average duration of user sessions on your app, allowing you to identify trends and make informed decisions to improve your app's user experience. The widget's number visualization type presents the total number of average session durations, along with a change indicator to show how performance has changed within your chosen time span.
Track your app's performance with Numerics' Average Session Duration - Historic widget. Keep a real-time snapshot of user time spent, making it easier to identify issues and opportunities. With the ability to track performance over time, you can quickly identify trends and make informed decisions to improve your app's user experience. The widget's change indicator allows you to see how performance has changed within your chosen time span, giving you the necessary context to take action.
Part of the google universal analytics


