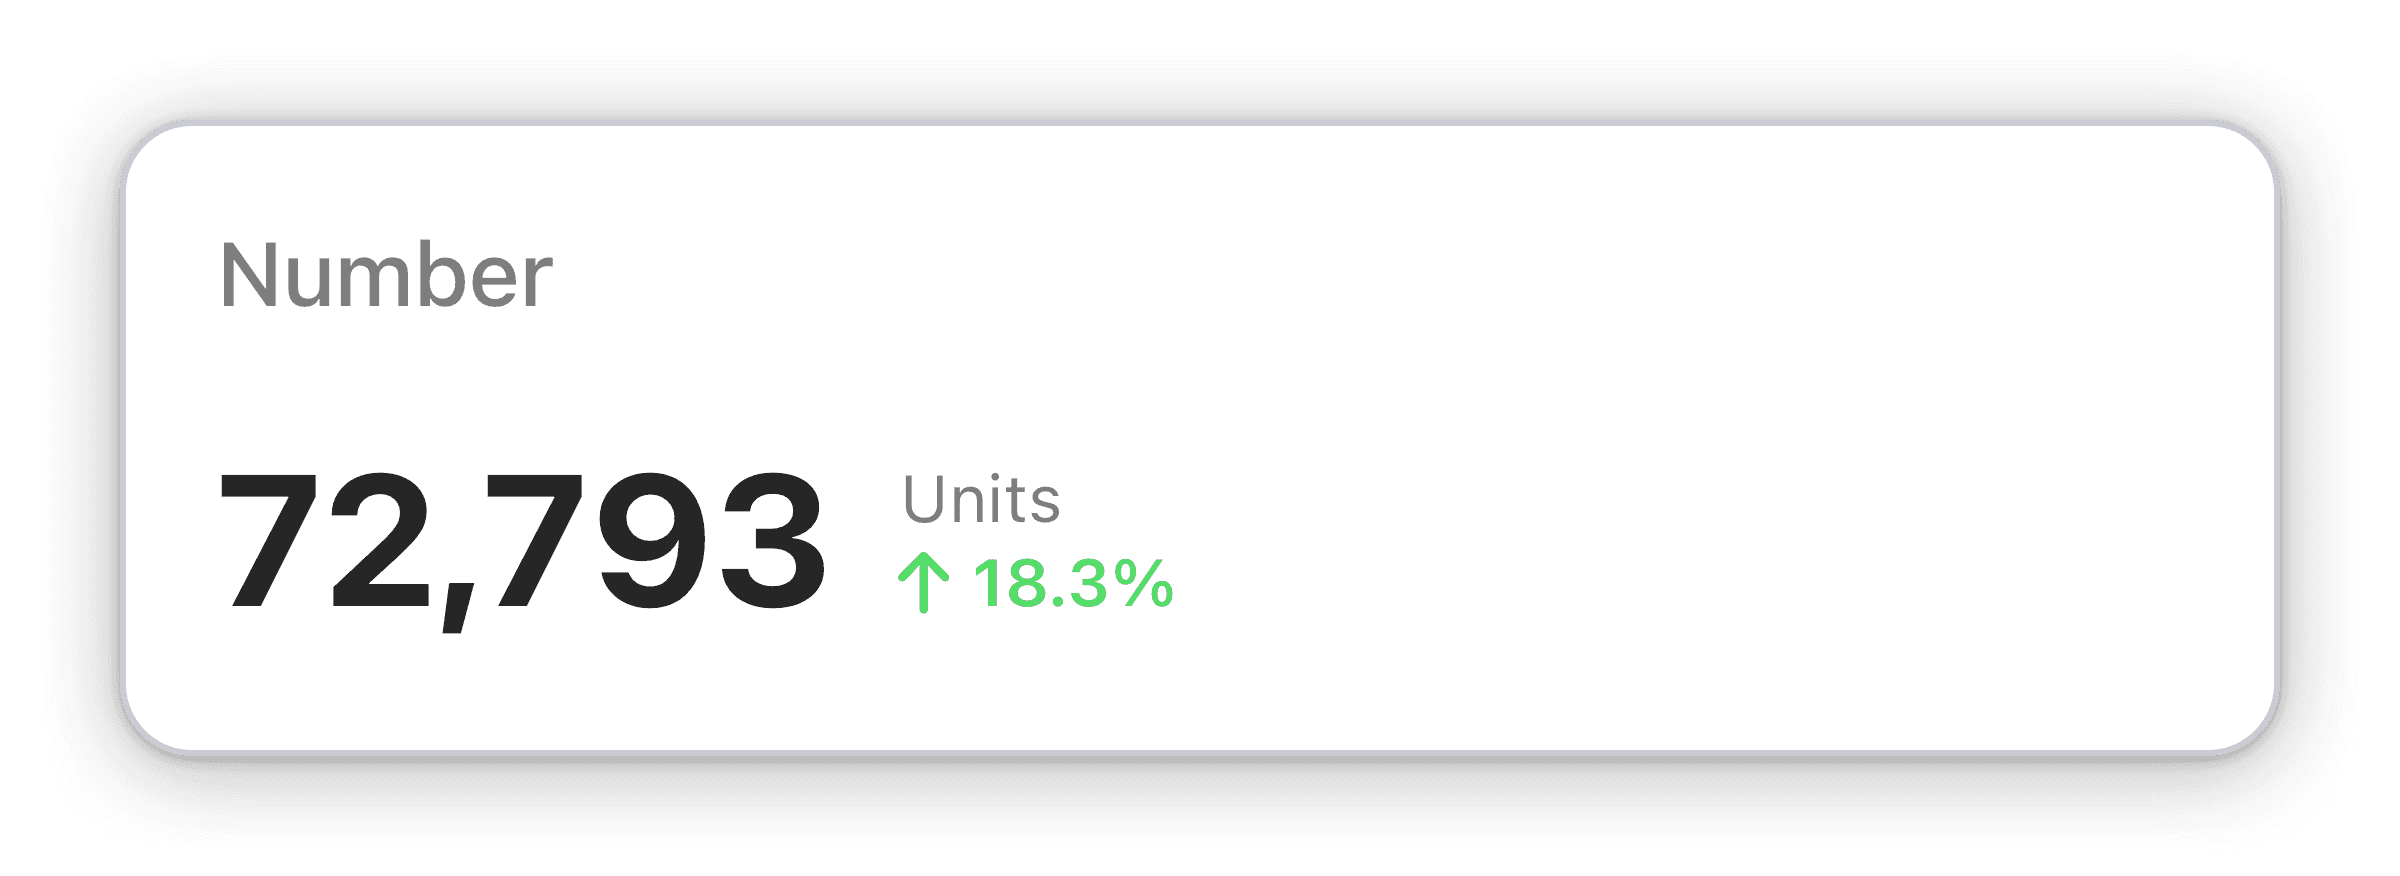
Average session duration - historic
The average duration users spend on your web property, along with the difference in percentage from its previous period within your chosen time span.
Track how long users spend on your site with the Average Session Duration widget. Optimize engagement, monitor changes in real-time.
The Average Session Duration widget provides a clear picture of how long users are spending on your web property. Numerics' number widget shows the average duration with a change indicator, allowing you to quickly monitor how this KPI is evolving over time. Use this widget to identify trends and optimize your web property to keep users engaged and coming back for more.
The Average Session Duration widget is a powerful tool that lets you track how long users are spending on your web property, and how that duration changes over time. Knowing this information can help you understand user behavior and identify areas for improvement. With Numerics, you can create a live dashboard to display this data, allowing you to monitor the average session duration in real-time and ensure that you're always on top of changes as they happen. This insight can help you optimize your web property to keep users engaged and coming back for more.
Part of the google universal analytics


