

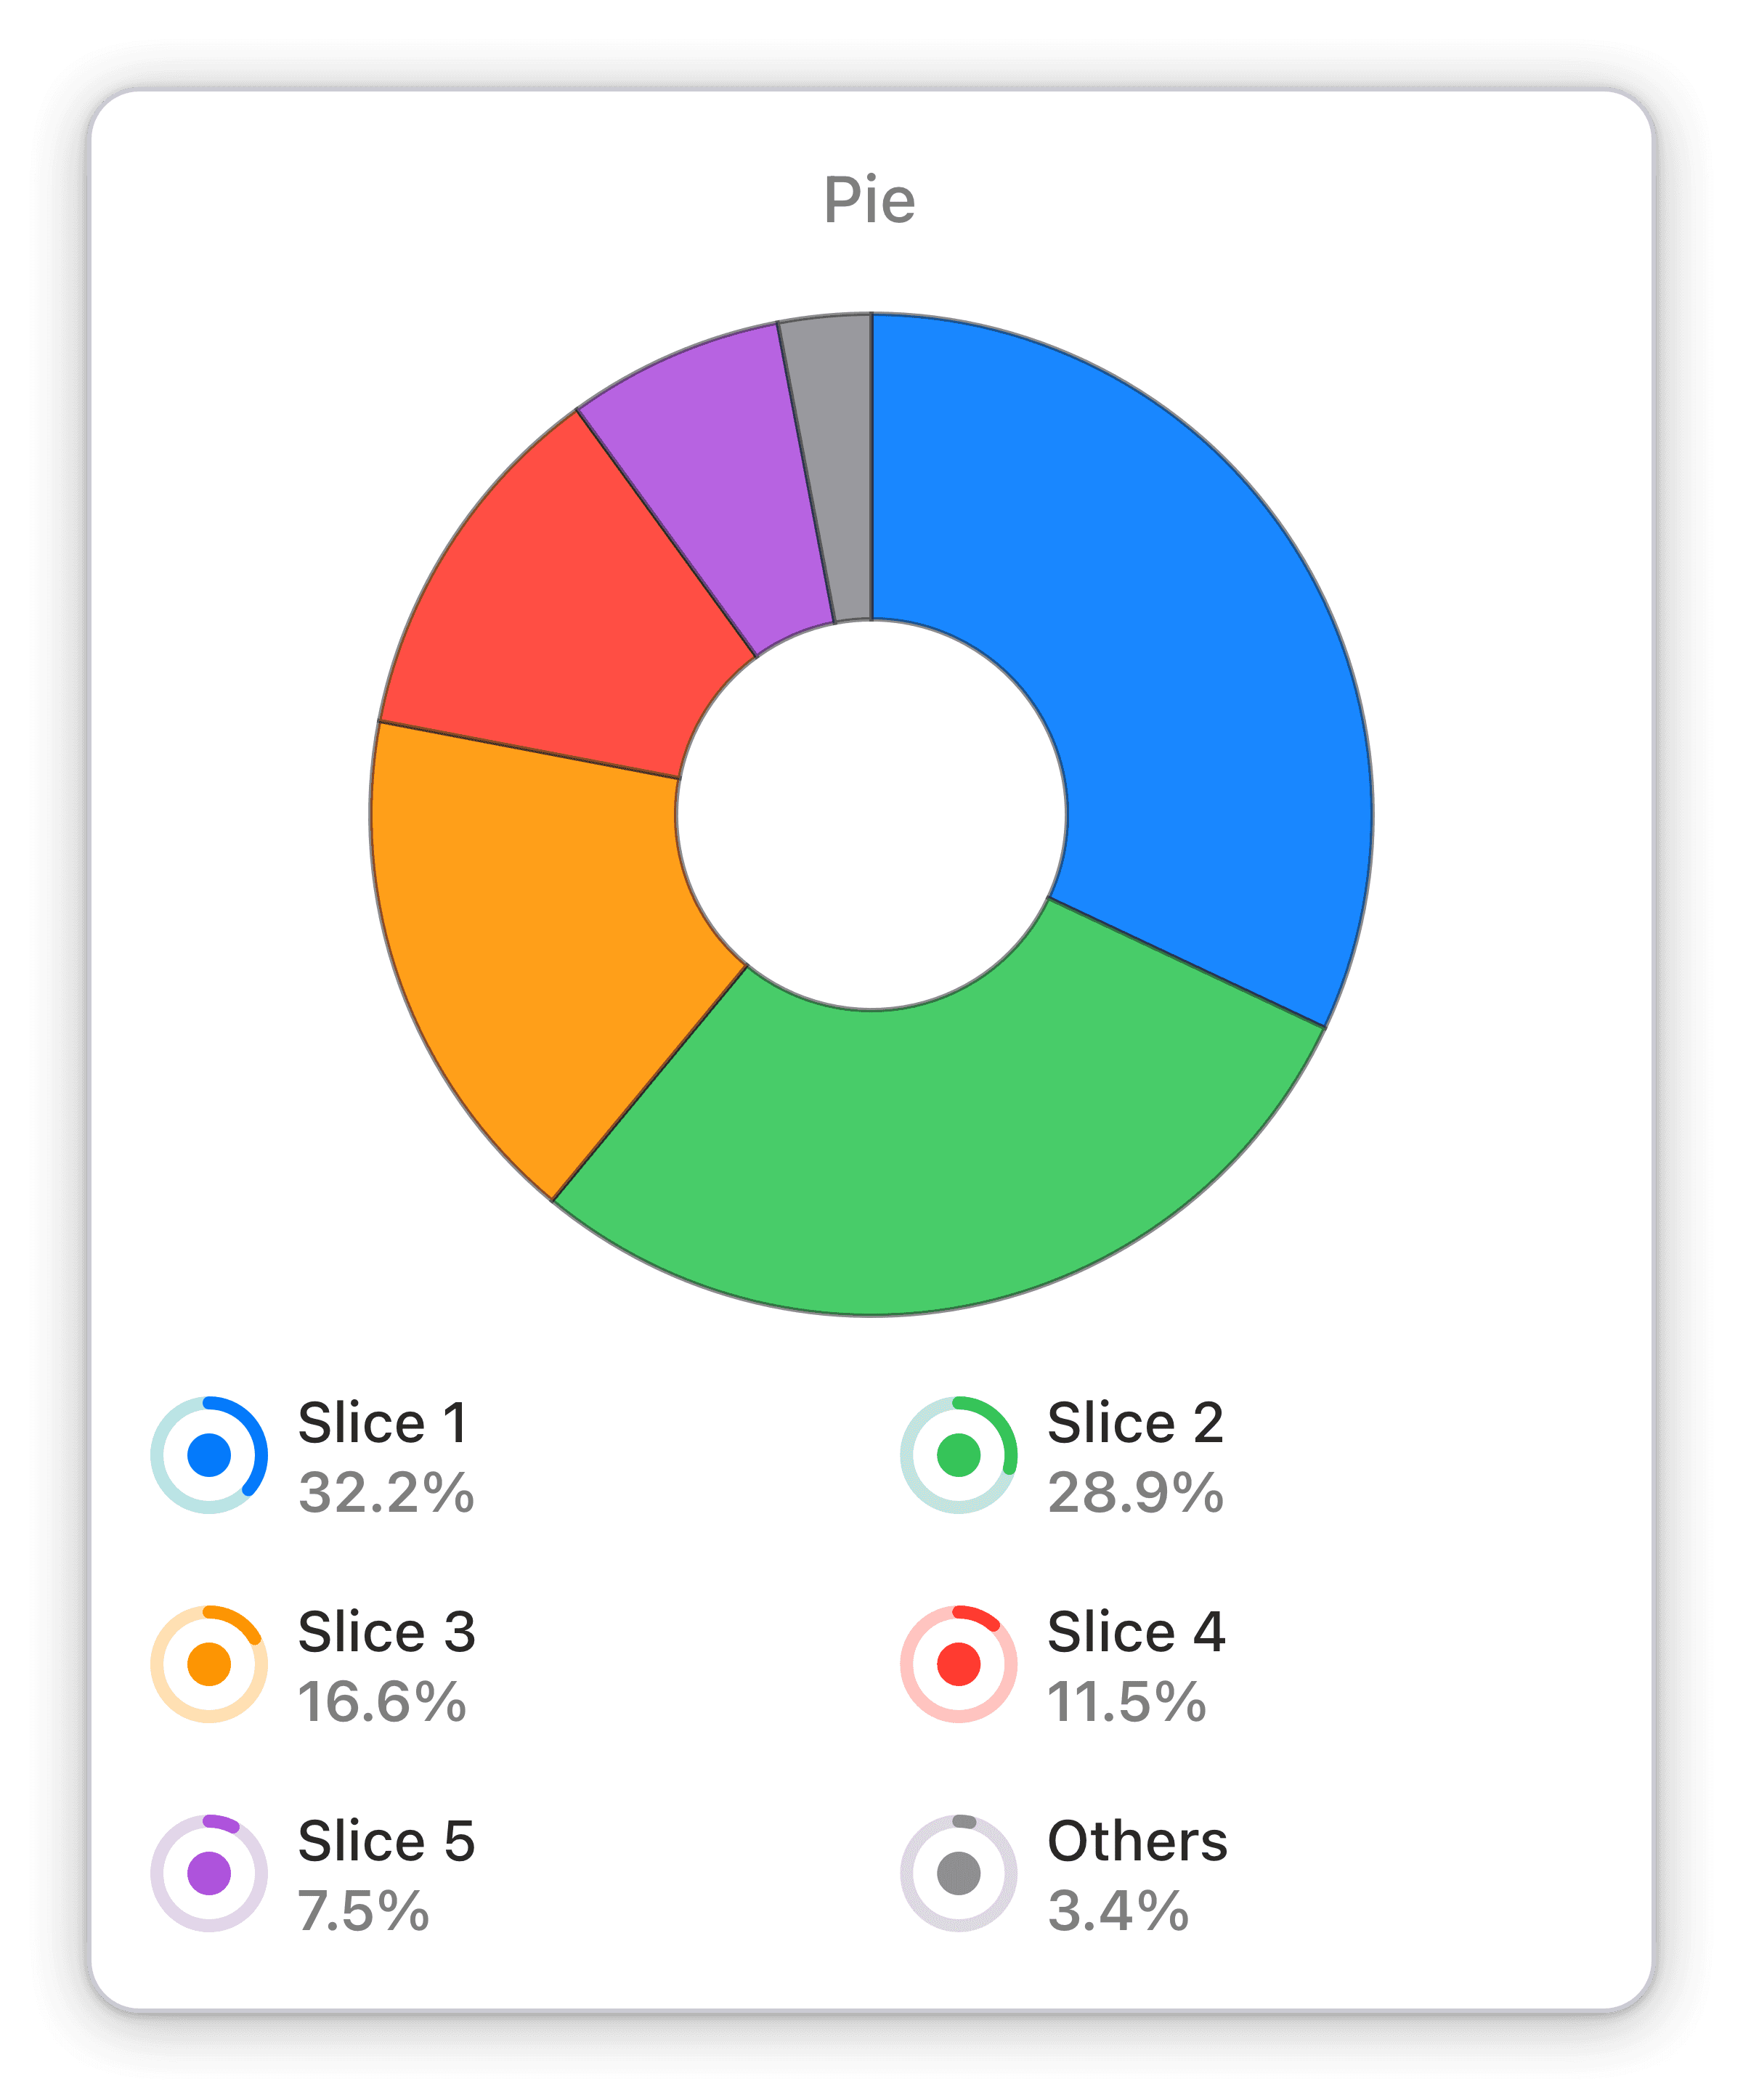
Distribution of bounces by sources
The bounces broken down by sources for your chosen analytics view within your chosen time span.
Optimize your HubSpot website by tracking the sources of bounces in real-time with Numerics' Distribution of Bounces Pie Chart.
The Distribution of Bounces by Sources Pie Chart widget for HubSpot Marketing Hub in Numerics provides a clear view of the sources of bounces on your website. With an interactive pie chart, users can easily understand the sources of bounces and take informed decisions in real-time.
Benefits of Tracking Distribution of bounces by sources in HubSpot Marketing Hub marketing dashboards
With Numerics' Distribution of Bounces by Sources Pie Chart widget, you can understand the sources of bounces on your HubSpot website and make informed decisions quickly. Track the distribution of bounces by sources in real-time, and optimize your website accordingly. With Numerics' visually appealing Pie Chart widget, you can easily identify the sources that are causing the most bounces, allowing you to take action and improve your website's performance. Keep an eye on your website's bounce rate with Numerics' Distribution of Bounces by Sources widget, and make data-driven decisions to boost your website's success.
Full Integration Details:
Part of the hubspot marketing hub
Page views Widget Pack


HubSpot Marketing Hub Integration Specifications:
Widget Templates:
262
Authentication Type:
OAuth 2.0
Supported plans:
Professional, Enterprise

