

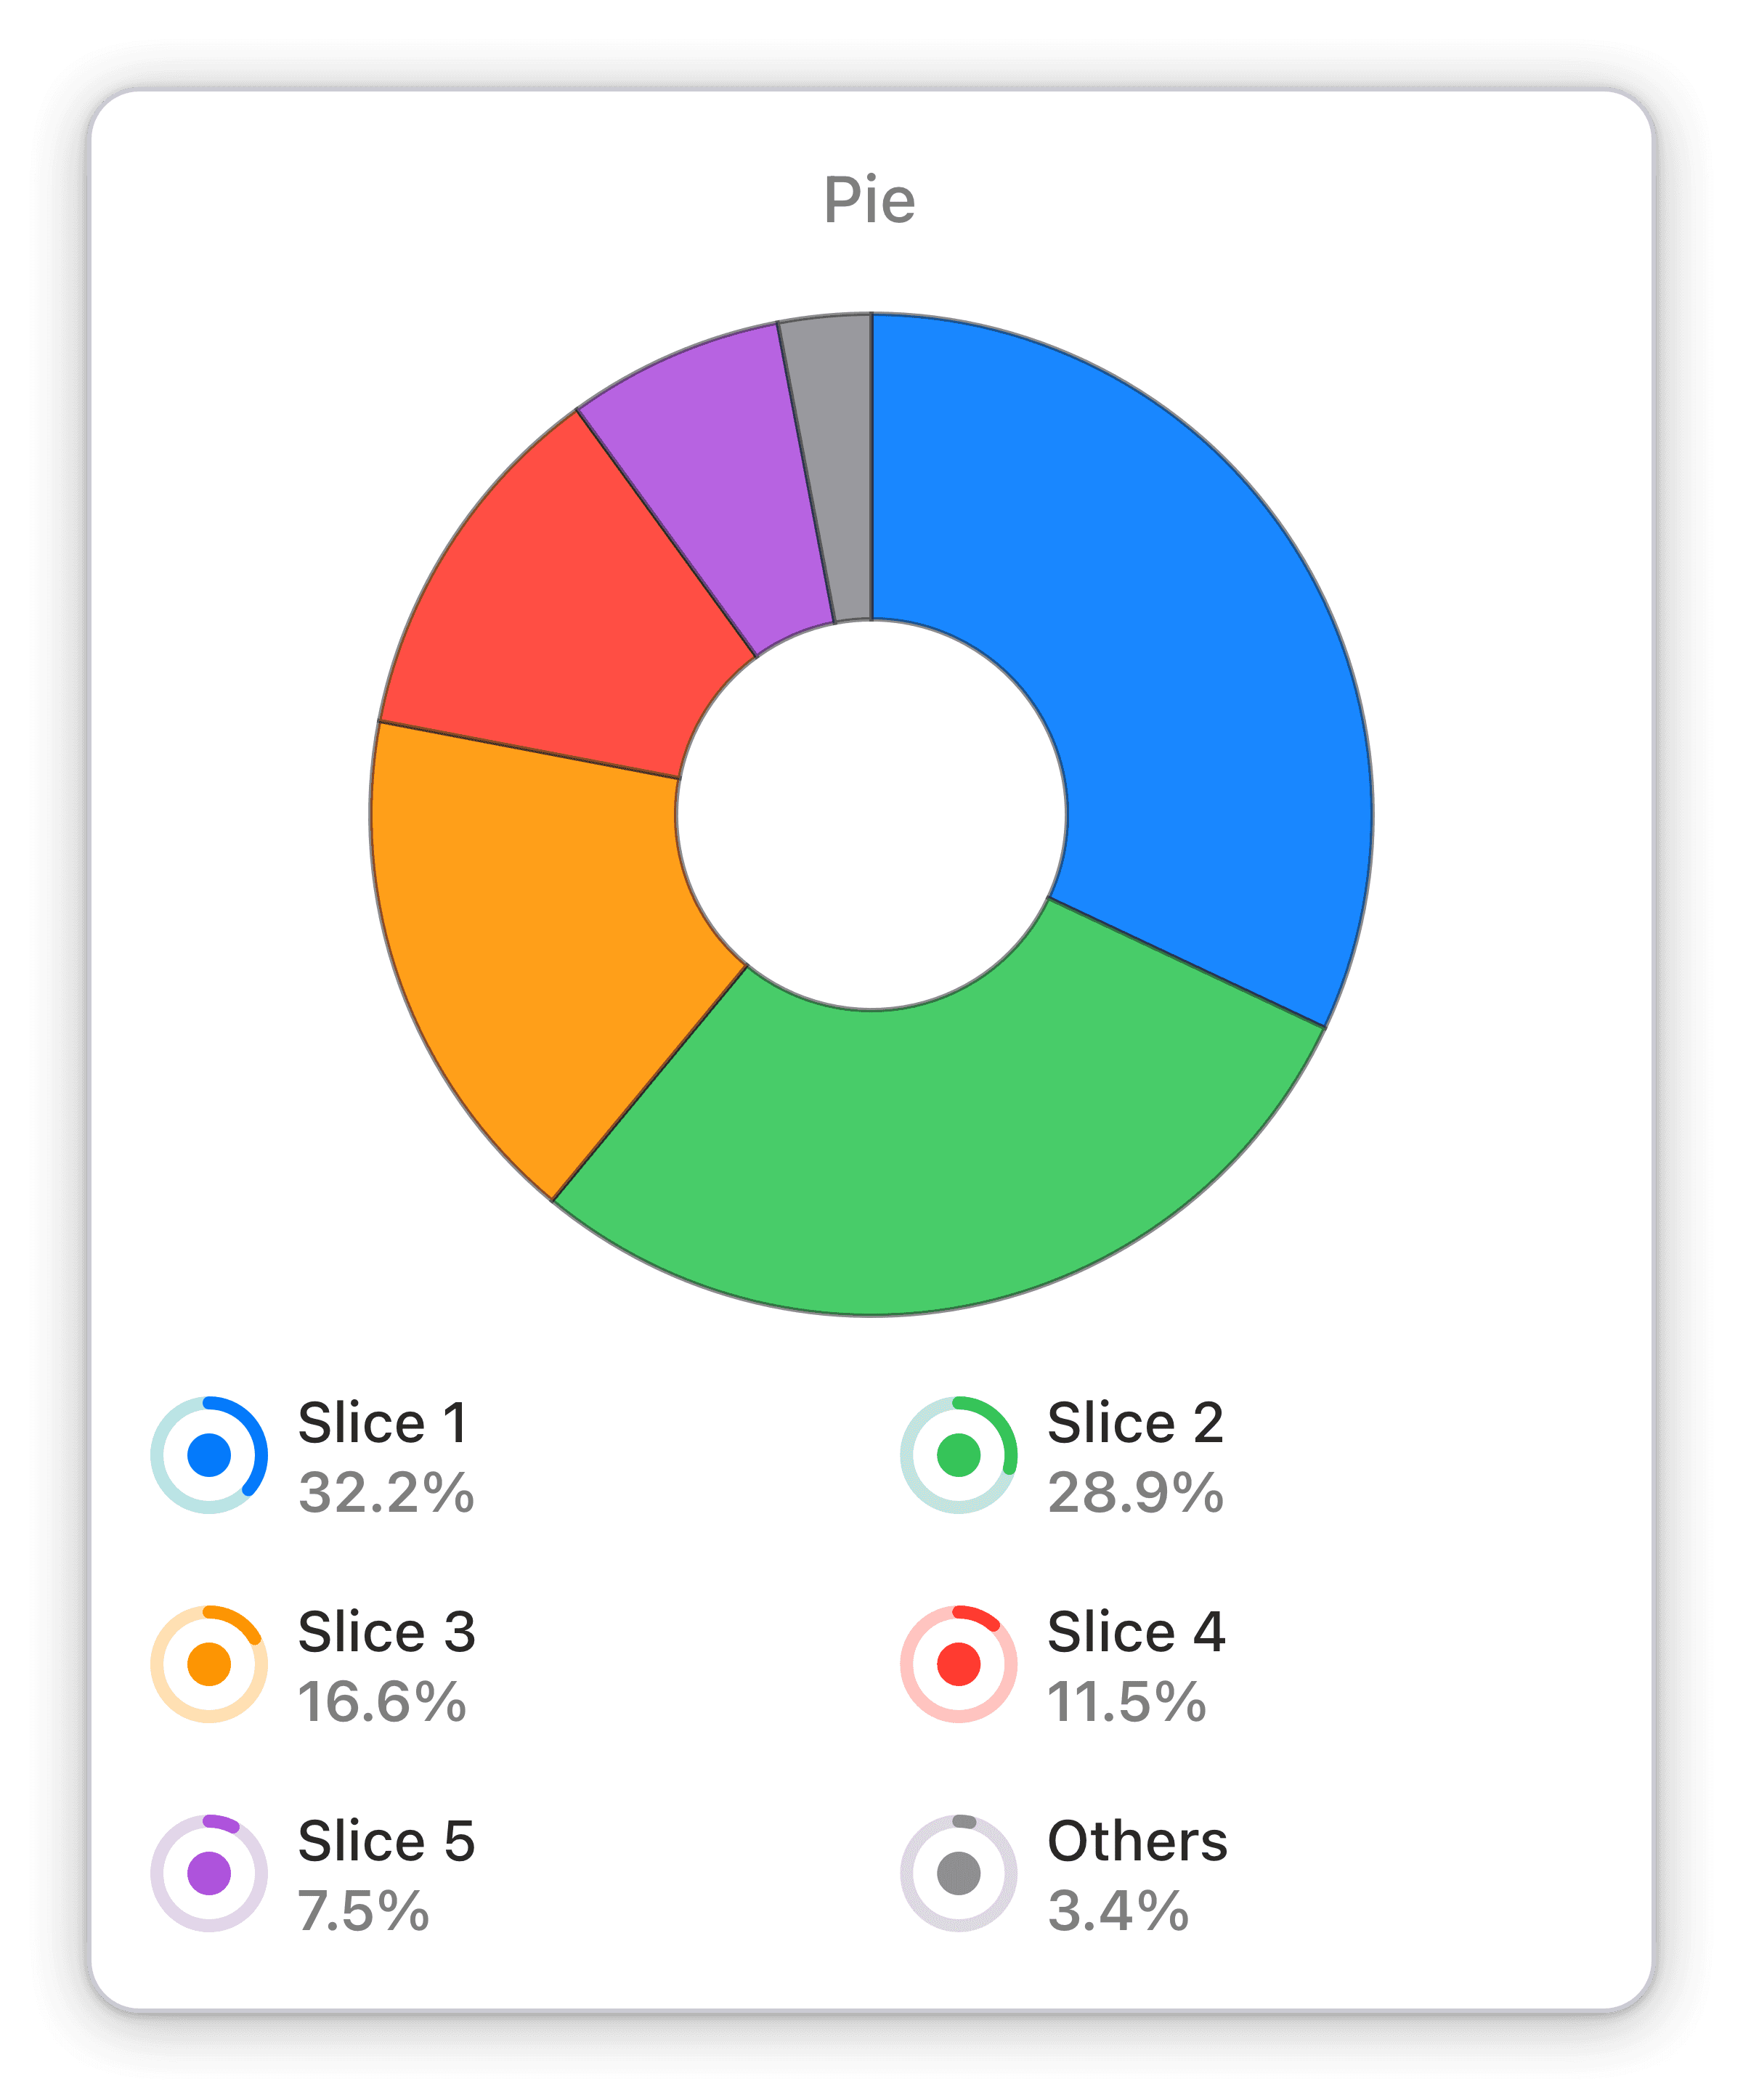
Page views by operating systems
The chosen page views broken down by operating systems for your chosen time span.
Track KPIs with ease using the Numerics Simple Analytics integration's real-time pie chart widget. View page views by operating system.
The pie chart widget in Numerics' Simple Analytics integration displays page views for each operating system in a chosen time span. The interactive, real-time chart helps you track your website's performance and make data-driven decisions.
Benefits of Tracking Page views by operating systems in Simple Analytics marketing dashboards
Tracking page views by operating system using Numerics' real-time pie chart widget is an essential tool for informed decision-making. With direct, secure connections from your devices to the data sources, Numerics is designed to be scalable and secure. The pie chart widget breaks down page views by operating system for a chosen time span, allowing you to track KPIs with ease. With an interactive format updated in real-time, Numerics' pie chart widget provides a comprehensive view of your website's performance.
Full Integration Details:
Part of the simple analytics
Operating Systems Widget Pack


Simple Analytics Integration Specifications:
Widget Templates:
62
Authentication Type:
Token based auth
Supported plans:
All

